
Hitchhiker's guide to Exploratory Data Analysis
Before we start looking for the hidden answers in this data, we’ll have to clean the data to prepare it for analysis.
#1 Data Cleansing Process
Data cleansing is the first and a very crucial step in the overall data preparation process and is the process of analysing, identifying and correcting messy, raw data
- We need to remove unused columns such as id, imdb_id, vote_count, production_company, keywords, homepage etc. It is always easier to make your decisions from the data which is actually relevant and concise.Here is how you can drop the redundant columns from the dataframe:
2. Removing the duplicacy in the rows (if any):
3. Some movies in the database have zero budget or zero revenue which implies that their values have not been recorded or some information is missing. We will be discarding such entries from the dataframe:
4. To manipulate the columns easily, it is important that we make use of the python objects. Changing release date column into Date format and extracting the year from the date which will help us in analysing yearly data.
5. Similarly, changing budget and revenue columns format to integer using numpy’s int64 method.
6. On checking the dataset, we see that genres, keywords, production_companies, production_countries, spoken_languages are in the JSON format which will make it while manipulating the dataframe. Now let’s flatten these columns into a format that can be easily interpreted.
We will convert them into strings and later convert them into lists. Writing a generic function to parse JSON columns.
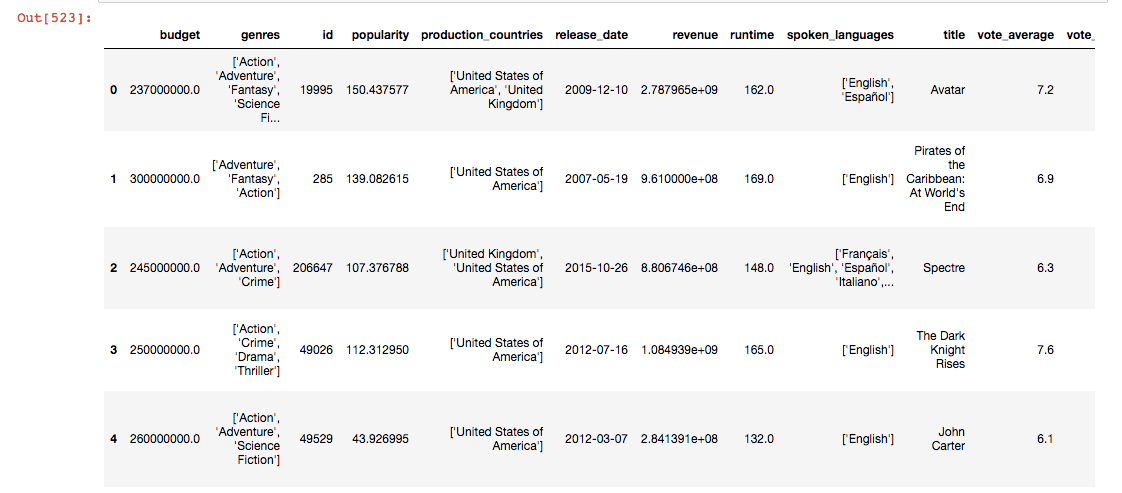
After cleansing, this is what the data looks like:

#2 Identifying relationships between variables / features
The main goal here is to identify and create relationships which can help you to build a hypothesis. We’ll have to define questions which can help us build some relationships to look at.
At this point, I came up with the following questions when I studied this dataset. You may come up with a different set of questions which are not listed below:
- Which are the 5 most expensive movies? Comparison between the extremes? Exploring the most expensive movies, it can tell you if they were even worth the money spent on them based on their performance and revenue generated.
2. Since we need to compare the minimums and maximums in 3 questions, we can write a generic function to do that for us and reuse that.
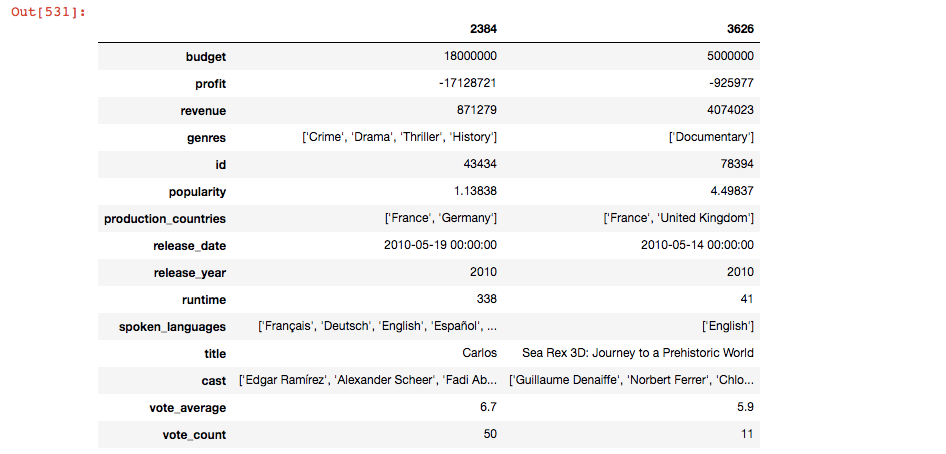
2. Top 5 most profitable movies? Comparison between the min and max profits. The comparison helps us in identifying the different approaches which failed and succeeded. If I subtract the budget from the revenue generated, it will give me the profit earned.
3. Most talked about Movies.
4. Average runtime of movies? Comparison between the extremes.

5. Movies which are rated above 7
6. Which year did we have the most profitable movies?This will help you raise some deeper questions about the years when movies didn’t do well or when they did. These are preliminary questions which give rise to questions providing deeper insights.
Let’s take a look at the spread of profitable movies over the years

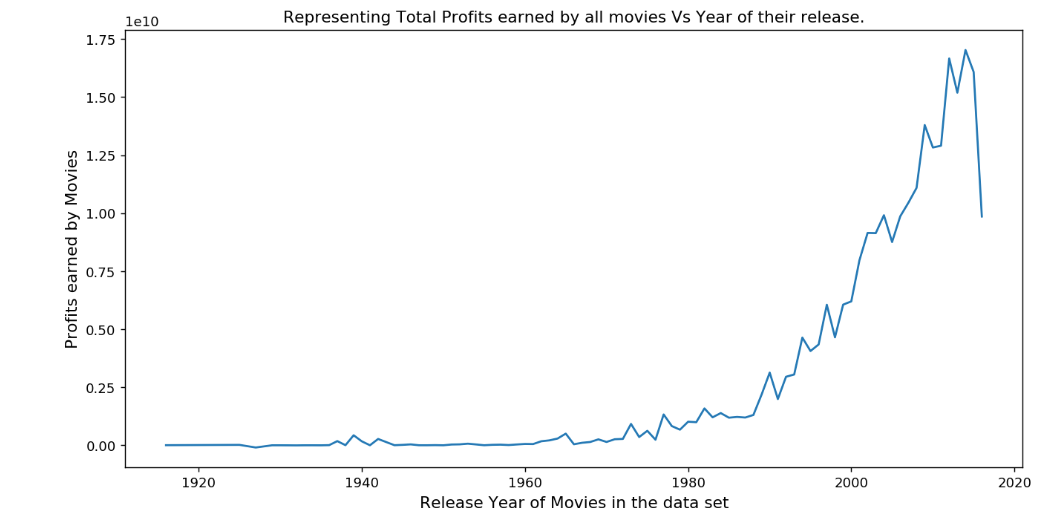
To find the year in which we had the most number of profitable movies, we used idxmax method :
This would give us 2014. You can look at all the output of these code snippets in the Ipython notebook here.