
四元數及姿態解算 Mahony算法
AHRS(attitude and heading reference system)稱為航姿參考系統。
首先,我們明確一下四元數的知識。
四元數(quaternion)是由我們的威廉·哈密頓提出的。哈密頓就是那個‘哈密頓最小作用原理’的提出者。
四元數可視為復數的擴展。在復數中,定義了,而四元數中則定義了
。也就是說四元數是一個具有三個虛部的虛數。把這些虛部理解為一個復數空間的話,四元數就是一個四位空間。這個是純數學問題,有興趣可以了解群論,本人也不是很理解所以也不多講啦。
但是四元數本身最多的就是使用單位四元數來表示三維空間的旋轉(rotation)及定向(orientation)。
為了方便,我們下面使用q = ((x, y, z),w) = (v, w),其中v是向量,w是實數,這樣的式子來表示一個四元數。下述內容采自知乎。
首先,定義一個你需要做的旋轉。旋轉軸為向量,旋轉角度為
(右手法則的旋轉)。如下圖所示:
此圖中,
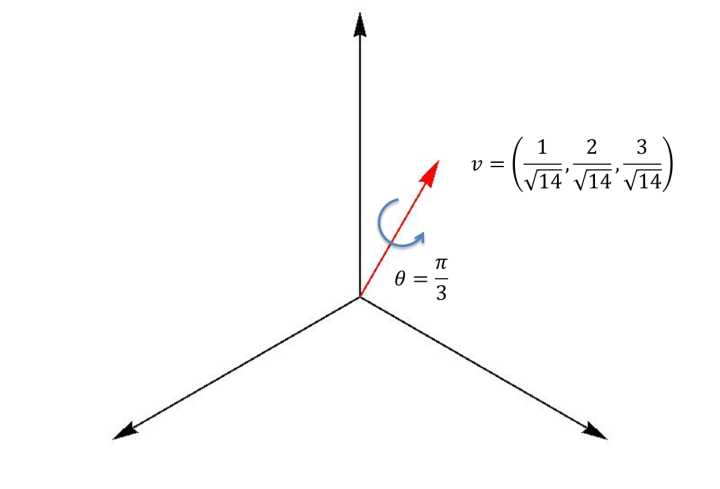
那麽與此相對應的四元數(下三行式子都是一個意思,只是不同的表達形式)
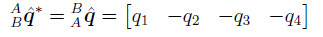
這時它的共軛(下三行式子都是一個意思,只是不同的表達形式),
如果你想算一個點在這個旋轉下新的坐標
,需要進行如下操作,
1.定義純四元數
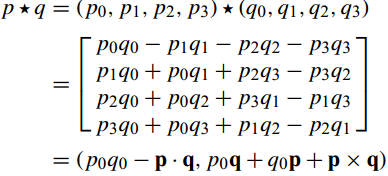
2.進行四元數運算
3.產生的一定是純四元數,也就是說它的第一項為0,有如下形式:
4.中的後三項
就是
:
這樣,就完成了一次四元數旋轉運算。
同理,如果你有一個四元數:
那麽,它對應一個以向量為軸旋轉
角度的旋轉操作(右手法則的旋轉)。

 。我們有:
。我們有:
- 封閉性:易證明,p和p的共軛相乘即可,|p*q|=1。
- 結合律:這條也很好證明,只要證明(p*q)*r=p*(q*r)。
更多資料可以參考:https://zhuanlan.zhihu.com/p/28189289
我們下一步來看一下通過陀螺儀輸出的角加速度估計姿態問題。
數學操作部分:
如果那些角速度被分配到向量
的時候。
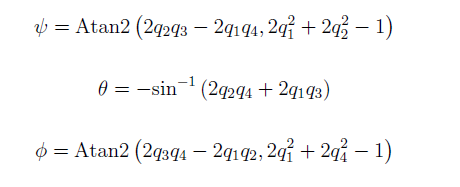
表示傳感器所在坐標相對於地磁坐標的姿態改變速率的四元數微分可以表示為下邊公式:
 為從E坐標到S坐標的預測值。
而在時間t,地球坐標系相對於傳感器坐標系的四元數 可以同過
可以同過 的積分獲得。而是通過預測值
 與時間t時刻形成的角速度
 的叉乘獲得的。
在不在對q進行二次處理的話,姿態預測值就是現在的姿態值。
下面就是一個求解傳感器所在坐標系的姿態。
開始,基於一個初始為[1 0 0 0]的四元數得到 q = [1 0 0 0], 根據加速度求得加速度的單位向量,根據q求轉換到b系的值v。
而 v = [2*(q(2)*q(4)-q(1)*q(3)) 2*(q(1)*q(2)+q(3)*q(4)) q(1)^2 -q(2)^2 -q(3)^2+q(4)^2]
而後計算誤差,其中加速度與計算得到的v的向量積可以得到誤差值。
計算得到的積分誤差為誤差的積分,即誤差和加上誤差乘以采樣時間。
經過PI降低陀螺儀的誤差。陀螺儀數據為自身數據加上P乘以誤差加I乘以積分誤差。 而後計算四元數的微分值等於0.5*上一次采樣的四元數乘角速度。 最後在對四元數進行積分得到當前四元數。最後再將四元數單位化為單位向量。 下面是這個過程的matlab源碼。classdef MahonyAHRS < handle
%MAYHONYAHRS Madgwick‘s implementation of Mayhony‘s AHRS algorithm
%
% For more information see:
% http://www.x-io.co.uk/node/8#open_source_ahrs_and_imu_algorithms
%
% Date Author Notes
% 28/09/2011 SOH Madgwick Initial release
%% Public properties
properties (Access = public)
SamplePeriod = 1/256;
Quaternion = [1 0 0 0]; % output quaternion describing the Earth relative to the sensor
Kp = 1; % algorithm proportional gain
Ki = 0; % algorithm integral gain
end
%% Public properties
properties (Access = private)
eInt = [0 0 0]; % integral error
end
%% Public methods
methods (Access = public)
function obj = MahonyAHRS(varargin)
for i = 1:2:nargin
if strcmp(varargin{i}, ‘SamplePeriod‘), obj.SamplePeriod = varargin{i+1};
elseif strcmp(varargin{i}, ‘Quaternion‘), obj.Quaternion = varargin{i+1};
elseif strcmp(varargin{i}, ‘Kp‘), obj.Kp = varargin{i+1};
elseif strcmp(varargin{i}, ‘Ki‘), obj.Ki = varargin{i+1};
else error(‘Invalid argument‘);
end
end;
end
function obj = Update(obj, Gyroscope, Accelerometer, Magnetometer)
q = obj.Quaternion; % short name local variable for readability
% Normalise accelerometer measurement
if(norm(Accelerometer) == 0), return; end % handle NaN
Accelerometer = Accelerometer / norm(Accelerometer); % normalise magnitude
% Normalise magnetometer measurement
if(norm(Magnetometer) == 0), return; end % handle NaN
Magnetometer = Magnetometer / norm(Magnetometer); % normalise magnitude
% Reference direction of Earth‘s magnetic feild
h = quaternProd(q, quaternProd([0 Magnetometer], quaternConj(q)));
b = [0 norm([h(2) h(3)]) 0 h(4)];
% Estimated direction of gravity and magnetic field
v = [2*(q(2)*q(4) - q(1)*q(3))
2*(q(1)*q(2) + q(3)*q(4))
q(1)^2 - q(2)^2 - q(3)^2 + q(4)^2];
w = [2*b(2)*(0.5 - q(3)^2 - q(4)^2) + 2*b(4)*(q(2)*q(4) - q(1)*q(3))
2*b(2)*(q(2)*q(3) - q(1)*q(4)) + 2*b(4)*(q(1)*q(2) + q(3)*q(4))
2*b(2)*(q(1)*q(3) + q(2)*q(4)) + 2*b(4)*(0.5 - q(2)^2 - q(3)^2)];
% Error is sum of cross product between estimated direction and measured direction of fields
e = cross(Accelerometer, v) + cross(Magnetometer, w);
if(obj.Ki > 0)
obj.eInt = obj.eInt + e * obj.SamplePeriod;
else
obj.eInt = [0 0 0];
end
% Apply feedback terms
Gyroscope = Gyroscope + obj.Kp * e + obj.Ki * obj.eInt;
% Compute rate of change of quaternion
qDot = 0.5 * quaternProd(q, [0 Gyroscope(1) Gyroscope(2) Gyroscope(3)]);
% Integrate to yield quaternion
q = q + qDot * obj.SamplePeriod;
obj.Quaternion = q / norm(q); % normalise quaternion
end
function obj = UpdateIMU(obj, Gyroscope, Accelerometer)
q = obj.Quaternion; % short name local variable for readability
% Normalise accelerometer measurement
if(norm(Accelerometer) == 0), return; end % handle NaN
Accelerometer = Accelerometer / norm(Accelerometer); % normalise magnitude
% Estimated direction of gravity and magnetic flux
v = [2*(q(2)*q(4) - q(1)*q(3))
2*(q(1)*q(2) + q(3)*q(4))
q(1)^2 - q(2)^2 - q(3)^2 + q(4)^2];
% Error is sum of cross product between estimated direction and measured direction of field
e = cross(Accelerometer, v);
if(obj.Ki > 0)
obj.eInt = obj.eInt + e * obj.SamplePeriod;
else
obj.eInt = [0 0 0];
end
% Apply feedback termszai
Gyroscope = Gyroscope + obj.Kp * e + obj.Ki * obj.eInt;
% Compute rate of change of quaternion
qDot = 0.5 * quaternProd(q, [0 Gyroscope(1) Gyroscope(2) Gyroscope(3)]);
% Integrate to yield quaternion
q = q + qDot * obj.SamplePeriod;
obj.Quaternion = q / norm(q); % normalise quaternion
end
end
end
在獲得的姿態上減去帶上方向的重力加速度,而後通過重力加速度進行積分,可以獲得速度。然而由於積分誤差的累計,會導致信號失真,並漂移。
所以通過高通濾波處理速度。
位移可以通過同樣的方法獲得。
代碼如下:
%% Housekeeping

addpath(‘ximu_matlab_library‘);	% include x-IMU MATLAB library
addpath(‘quaternion_library‘);	% include quatenrion library
close all;                     	% close all figures
clear;                         	% clear all variables
clc;                          	% clear the command terminal

%% Import data

xIMUdata = xIMUdataClass(‘LoggedData/LoggedData‘);

samplePeriod = 1/256;

gyr = [xIMUdata.CalInertialAndMagneticData.Gyroscope.X...
       xIMUdata.CalInertialAndMagneticData.Gyroscope.Y...
       xIMUdata.CalInertialAndMagneticData.Gyroscope.Z];        % gyroscope
acc = [xIMUdata.CalInertialAndMagneticData.Accelerometer.X...
       xIMUdata.CalInertialAndMagneticData.Accelerometer.Y...
       xIMUdata.CalInertialAndMagneticData.Accelerometer.Z];	% accelerometer

% Plot
figure(‘NumberTitle‘, ‘off‘, ‘Name‘, ‘Gyroscope‘);
hold on;
plot(gyr(:,1), ‘r‘);
plot(gyr(:,2), ‘g‘);
plot(gyr(:,3), ‘b‘);
xlabel(‘sample‘);
ylabel(‘dps‘);
title(‘Gyroscope‘);
legend(‘X‘, ‘Y‘, ‘Z‘);

figure(‘NumberTitle‘, ‘off‘, ‘Name‘, ‘Accelerometer‘);
hold on;
plot(acc(:,1), ‘r‘);
plot(acc(:,2), ‘g‘);
plot(acc(:,3), ‘b‘);
xlabel(‘sample‘);
ylabel(‘g‘);
title(‘Accelerometer‘);
legend(‘X‘, ‘Y‘, ‘Z‘);

%% Process data through AHRS algorithm (calcualte orientation)
% See: http://www.x-io.co.uk/open-source-imu-and-ahrs-algorithms/

R = zeros(3,3,length(gyr));     % rotation matrix describing sensor relative to Earth

ahrs = MahonyAHRS(‘SamplePeriod‘, samplePeriod, ‘Kp‘, 1);

for i = 1:length(gyr)
    ahrs.UpdateIMU(gyr(i,:) * (pi/180), acc(i,:));	% gyroscope units must be radians
    R(:,:,i) = quatern2rotMat(ahrs.Quaternion)‘;    % transpose because ahrs provides Earth relative to sensor
end

%% Calculate ‘tilt-compensated‘ accelerometer

tcAcc = zeros(size(acc));  % accelerometer in Earth frame

for i = 1:length(acc)
    tcAcc(i,:) = R(:,:,i) * acc(i,:)‘;
end

% Plot
figure(‘NumberTitle‘, ‘off‘, ‘Name‘, ‘‘‘Tilt-Compensated‘‘ accelerometer‘);
hold on;
plot(tcAcc(:,1), ‘r‘);
plot(tcAcc(:,2), ‘g‘);
plot(tcAcc(:,3), ‘b‘);
xlabel(‘sample‘);
ylabel(‘g‘);
title(‘‘‘Tilt-compensated‘‘ accelerometer‘);
legend(‘X‘, ‘Y‘, ‘Z‘);

%% Calculate linear acceleration in Earth frame (subtracting gravity)

linAcc = tcAcc - [zeros(length(tcAcc), 1), zeros(length(tcAcc), 1), ones(length(tcAcc), 1)];
linAcc = linAcc * 9.81;     % convert from ‘g‘ to m/s/s

% Plot
figure(‘NumberTitle‘, ‘off‘, ‘Name‘, ‘Linear Acceleration‘);
hold on;
plot(linAcc(:,1), ‘r‘);
plot(linAcc(:,2), ‘g‘);
plot(linAcc(:,3), ‘b‘);
xlabel(‘sample‘);
ylabel(‘g‘);
title(‘Linear acceleration‘);
legend(‘X‘, ‘Y‘, ‘Z‘);

%% Calculate linear velocity (integrate acceleartion)

linVel = zeros(size(linAcc));

for i = 2:length(linAcc)
    linVel(i,:) = linVel(i-1,:) + linAcc(i,:) * samplePeriod;
end

% Plot
figure(‘NumberTitle‘, ‘off‘, ‘Name‘, ‘Linear Velocity‘);
hold on;
plot(linVel(:,1), ‘r‘);
plot(linVel(:,2), ‘g‘);
plot(linVel(:,3), ‘b‘);
xlabel(‘sample‘);
ylabel(‘g‘);
title(‘Linear velocity‘);
legend(‘X‘, ‘Y‘, ‘Z‘);

%% High-pass filter linear velocity to remove drift

order = 1;
filtCutOff = 0.1;
[b, a] = butter(order, (2*filtCutOff)/(1/samplePeriod), ‘high‘);
linVelHP = filtfilt(b, a, linVel);

% Plot
figure(‘NumberTitle‘, ‘off‘, ‘Name‘, ‘High-pass filtered Linear Velocity‘);
hold on;
plot(linVelHP(:,1), ‘r‘);
plot(linVelHP(:,2), ‘g‘);
plot(linVelHP(:,3), ‘b‘);
xlabel(‘sample‘);
ylabel(‘g‘);
title(‘High-pass filtered linear velocity‘);
legend(‘X‘, ‘Y‘, ‘Z‘);

%% Calculate linear position (integrate velocity)

linPos = zeros(size(linVelHP));

for i = 2:length(linVelHP)
    linPos(i,:) = linPos(i-1,:) + linVelHP(i,:) * samplePeriod;
end

% Plot
figure(‘NumberTitle‘, ‘off‘, ‘Name‘, ‘Linear Position‘);
hold on;
plot(linPos(:,1), ‘r‘);
plot(linPos(:,2), ‘g‘);
plot(linPos(:,3), ‘b‘);
xlabel(‘sample‘);
ylabel(‘g‘);
title(‘Linear position‘);
legend(‘X‘, ‘Y‘, ‘Z‘);

%% High-pass filter linear position to remove drift

order = 1;
filtCutOff = 0.1;
[b, a] = butter(order, (2*filtCutOff)/(1/samplePeriod), ‘high‘);
linPosHP = filtfilt(b, a, linPos);

% Plot
figure(‘NumberTitle‘, ‘off‘, ‘Name‘, ‘High-pass filtered Linear Position‘);
hold on;
plot(linPosHP(:,1), ‘r‘);
plot(linPosHP(:,2), ‘g‘);
plot(linPosHP(:,3), ‘b‘);
xlabel(‘sample‘);
ylabel(‘g‘);
title(‘High-pass filtered linear position‘);
legend(‘X‘, ‘Y‘, ‘Z‘);

%% Play animation

SamplePlotFreq = 8;

SixDOFanimation(linPosHP, R, ...
                ‘SamplePlotFreq‘, SamplePlotFreq, ‘Trail‘, ‘Off‘, ...
                ‘Position‘, [9 39 1280 720], ...
                ‘AxisLength‘, 0.1, ‘ShowArrowHead‘, false, ...
                ‘Xlabel‘, ‘X (m)‘, ‘Ylabel‘, ‘Y (m)‘, ‘Zlabel‘, ‘Z (m)‘, ‘ShowLegend‘, false, ‘Title‘, ‘Unfiltered‘,...
                ‘CreateAVI‘, false, ‘AVIfileNameEnum‘, false, ‘AVIfps‘, ((1/samplePeriod) / SamplePlotFreq));

%% End of script
而最後的SixDOFanimation函數如下:
function fig = SixDOFanimation(varargin)

    %% Create local variables

    % Required arguments
    p = varargin{1};                % position of body
    R = varargin{2};                % rotation matrix of body
    [numSamples dummy] = size(p);

    % Default values of optional arguments
    SamplePlotFreq = 1;
    Trail = ‘Off‘;
    LimitRatio = 1;
    Position = [];
    FullScreen = false;
    View = [30 20];
    AxisLength = 1;
    ShowArrowHead = ‘on‘;
    Xlabel = ‘X‘;
    Ylabel = ‘Y‘;
    Zlabel = ‘Z‘;
    Title = ‘6DOF Animation‘;
    ShowLegend = true;
    CreateAVI = false;
    AVIfileName = ‘6DOF Animation‘;
    AVIfileNameEnum = true;
    AVIfps = 30;

    for i = 3:2:nargin
        if  strcmp(varargin{i}, ‘SamplePlotFreq‘), SamplePlotFreq = varargin{i+1};
        elseif  strcmp(varargin{i}, ‘Trail‘)
            Trail = varargin{i+1};
            if(~strcmp(Trail, ‘Off‘) && ~strcmp(Trail, ‘DotsOnly‘) && ~strcmp(Trail, ‘All‘))
                error(‘Invalid argument.  Trail must be ‘‘Off‘‘, ‘‘DotsOnly‘‘ or ‘‘All‘‘.‘);
            end
        elseif  strcmp(varargin{i}, ‘LimitRatio‘), LimitRatio = varargin{i+1};
        elseif  strcmp(varargin{i}, ‘Position‘), Position = varargin{i+1};
        elseif  strcmp(varargin{i}, ‘FullScreen‘), FullScreen = varargin{i+1};
        elseif  strcmp(varargin{i}, ‘View‘), View = varargin{i+1};
        elseif  strcmp(varargin{i}, ‘AxisLength‘), AxisLength = varargin{i+1};
        elseif  strcmp(varargin{i}, ‘ShowArrowHead‘), ShowArrowHead = varargin{i+1};
        elseif  strcmp(varargin{i}, ‘Xlabel‘), Xlabel = varargin{i+1};
        elseif  strcmp(varargin{i}, ‘Ylabel‘), Ylabel = varargin{i+1};
        elseif  strcmp(varargin{i}, ‘Zlabel‘), Zlabel = varargin{i+1};
        elseif  strcmp(varargin{i}, ‘Title‘), Title = varargin{i+1};
        elseif  strcmp(varargin{i}, ‘ShowLegend‘), ShowLegend = varargin{i+1};
        elseif  strcmp(varargin{i}, ‘CreateAVI‘), CreateAVI = varargin{i+1};
        elseif  strcmp(varargin{i}, ‘AVIfileName‘), AVIfileName = varargin{i+1};
        elseif  strcmp(varargin{i}, ‘AVIfileNameEnum‘), AVIfileNameEnum = varargin{i+1};
        elseif  strcmp(varargin{i}, ‘AVIfps‘), AVIfps = varargin{i+1};
        else error(‘Invalid argument.‘);
        end
    end;

    %% Reduce data to samples to plot only

    p = p(1:SamplePlotFreq:numSamples, :);
    R = R(:, :, 1:SamplePlotFreq:numSamples) * AxisLength;
    if(numel(View) > 2)
        View = View(1:SamplePlotFreq:numSamples, :);
    end
    [numPlotSamples dummy] = size(p);

    %% Setup AVI file

    aviobj = [];                                                            	% create null object
    if(CreateAVI)
        fileName = strcat(AVIfileName, ‘.avi‘);
        if(exist(fileName, ‘file‘))
            if(AVIfileNameEnum)                                              	% if file name exists and enum enabled
                i = 0;
                while(exist(fileName, ‘file‘))                                  % find un-used file name by appending enum
                    fileName = strcat(AVIfileName, sprintf(‘%i‘, i), ‘.avi‘);
                    i = i + 1;
                end
            else                                                                % else file name exists and enum disabled
                fileName = [];                                                  % file will not be created
            end
        end
        if(isempty(fileName))
            sprintf(‘AVI file not created as file already exists.‘)
        else
            aviobj = avifile(fileName, ‘fps‘, AVIfps, ‘compression‘, ‘Cinepak‘, ‘quality‘, 100);
        end
    end

    %% Setup figure and plot

    % Create figure
    fig = figure(‘NumberTitle‘, ‘off‘, ‘Name‘, ‘6DOF Animation‘);
    if(FullScreen)
        screenSize = get(0, ‘ScreenSize‘);
        set(fig, ‘Position‘, [0 0 screenSize(3) screenSize(4)]);
    elseif(~isempty(Position))
        set(fig, ‘Position‘, Position);
    end
    set(gca, ‘drawmode‘, ‘fast‘);
    lighting phong;
    set(gcf, ‘Renderer‘, ‘zbuffer‘);
    hold on;
    axis equal;
    grid on;
    view(View(1, 1), View(1, 2));
    title(i);
    xlabel(Xlabel);
    ylabel(Ylabel);
    zlabel(Zlabel);

    % Create plot data arrays
    if(strcmp(Trail, ‘DotsOnly‘) || strcmp(Trail, ‘All‘))
        x = zeros(numPlotSamples, 1);
        y = zeros(numPlotSamples, 1);
        z = zeros(numPlotSamples, 1);
    end
    if(strcmp(Trail, ‘All‘))
        ox = zeros(numPlotSamples, 1);
        oy = zeros(numPlotSamples, 1);
        oz = zeros(numPlotSamples, 1);
        ux = zeros(numPlotSamples, 1);
        vx = zeros(numPlotSamples, 1);
        wx = zeros(numPlotSamples, 1);
        uy = zeros(numPlotSamples, 1);
        vy = zeros(numPlotSamples, 1);
        wy = zeros(numPlotSamples, 1);
        uz = zeros(numPlotSamples, 1);
        vz = zeros(numPlotSamples, 1);
        wz = zeros(numPlotSamples, 1);
    end
    x(1) = p(1,1);
    y(1) = p(1,2);
    z(1) = p(1,3);
    ox(1) = x(1);
    oy(1) = y(1);
    oz(1) = z(1);
    ux(1) = R(1,1,1:1);
    vx(1) = R(2,1,1:1);
    wx(1) = R(3,1,1:1);
    uy(1) = R(1,2,1:1);
    vy(1) = R(2,2,1:1);
    wy(1) = R(3,2,1:1);
    uz(1) = R(1,3,1:1);
    vz(1) = R(2,3,1:1);
    wz(1) = R(3,3,1:1);

    % Create graphics handles
    orgHandle = plot3(x, y, z, ‘k.‘);
    if(ShowArrowHead)
        ShowArrowHeadStr = ‘on‘;
    else
        ShowArrowHeadStr = ‘off‘;
    end
    quivXhandle = quiver3(ox, oy, oz, ux, vx, wx,  ‘r‘, ‘ShowArrowHead‘, ShowArrowHeadStr, ‘MaxHeadSize‘, 0.999999, ‘AutoScale‘, ‘off‘);
    quivYhandle = quiver3(ox, oy, oz, uy, vy, wy,  ‘g‘, ‘ShowArrowHead‘, ShowArrowHeadStr, ‘MaxHeadSize‘, 0.999999, ‘AutoScale‘, ‘off‘);
    quivZhandle = quiver3(ox, ox, oz, uz, vz, wz,  ‘b‘, ‘ShowArrowHead‘, ShowArrowHeadStr, ‘MaxHeadSize‘, 0.999999, ‘AutoScale‘, ‘off‘);

    % Create legend
    if(ShowLegend)
        legend(‘Origin‘, ‘X‘, ‘Y‘, ‘Z‘);
    end

    % Set initial limits
    Xlim = [x(1)-AxisLength x(1)+AxisLength] * LimitRatio;
    Ylim = [y(1)-AxisLength y(1)+AxisLength] * LimitRatio;
    Zlim = [z(1)-AxisLength z(1)+AxisLength] * LimitRatio;
    set(gca, ‘Xlim‘, Xlim, ‘Ylim‘, Ylim, ‘Zlim‘, Zlim);

    % Set initial view
    view(View(1, :));

    %% Plot one sample at a time

    for i = 1:numPlotSamples

        % Update graph title
        if(strcmp(Title, ‘‘))
            titleText = sprintf(‘Sample %i of %i‘, 1+((i-1)*SamplePlotFreq), numSamples);
        else
            titleText = strcat(Title, ‘ (‘, sprintf(‘Sample %i of %i‘, 1+((i-1)*SamplePlotFreq), numSamples), ‘)‘);
        end
        title(titleText);

        % Plot body x y z axes
        if(strcmp(Trail, ‘DotsOnly‘) || strcmp(Trail, ‘All‘))
            x(1:i) = p(1:i,1);
            y(1:i) = p(1:i,2);
            z(1:i) = p(1:i,3);
        else
            x = p(i,1);
            y = p(i,2);
            z = p(i,3);
        end
        if(strcmp(Trail, ‘All‘))
            ox(1:i) = p(1:i,1);
            oy(1:i) = p(1:i,2);
            oz(1:i) = p(1:i,3);
            ux(1:i) = R(1,1,1:i);
            vx(1:i) = R(2,1,1:i);
            wx(1:i) = R(3,1,1:i);
            uy(1:i) = R(1,2,1:i);
            vy(1:i) = R(2,2,1:i);
            wy(1:i) = R(3,2,1:i);
            uz(1:i) = R(1,3,1:i);
            vz(1:i) = R(2,3,1:i);
            wz(1:i) = R(3,3,1:i);
        else
            ox = p(i,1);
            oy = p(i,2);
            oz = p(i,3);
            ux = R(1,1,i);
            vx = R(2,1,i);
            wx = R(3,1,i);
            uy = R(1,2,i);
            vy = R(2,2,i);
            wy = R(3,2,i);
            uz = R(1,3,i);
            vz = R(2,3,i);
            wz = R(3,3,i);
        end
        set(orgHandle, ‘xdata‘, x, ‘ydata‘, y, ‘zdata‘, z);
        set(quivXhandle, ‘xdata‘, ox, ‘ydata‘, oy, ‘zdata‘, oz,‘udata‘, ux, ‘vdata‘, vx, ‘wdata‘, wx);
        set(quivYhandle, ‘xdata‘, ox, ‘ydata‘, oy, ‘zdata‘, oz,‘udata‘, uy, ‘vdata‘, vy, ‘wdata‘, wy);
        set(quivZhandle, ‘xdata‘, ox, ‘ydata‘, oy, ‘zdata‘, oz,‘udata‘, uz, ‘vdata‘, vz, ‘wdata‘, wz);

        % Adjust axes for snug fit and draw
        axisLimChanged = false;
        if((p(i,1) - AxisLength) < Xlim(1)), Xlim(1) = p(i,1) - LimitRatio*AxisLength; axisLimChanged = true; end
        if((p(i,2) - AxisLength) < Ylim(1)), Ylim(1) = p(i,2) - LimitRatio*AxisLength; axisLimChanged = true; end
        if((p(i,3) - AxisLength) < Zlim(1)), Zlim(1) = p(i,3) - LimitRatio*AxisLength; axisLimChanged = true; end
        if((p(i,1) + AxisLength) > Xlim(2)), Xlim(2) = p(i,1) + LimitRatio*AxisLength; axisLimChanged = true; end
        if((p(i,2) + AxisLength) > Ylim(2)), Ylim(2) = p(i,2) + LimitRatio*AxisLength; axisLimChanged = true; end
        if((p(i,3) + AxisLength) > Zlim(2)), Zlim(2) = p(i,3) + LimitRatio*AxisLength; axisLimChanged = true; end
        if(axisLimChanged), set(gca, ‘Xlim‘, Xlim, ‘Ylim‘, Ylim, ‘Zlim‘, Zlim); end
        drawnow;

        % Adjust view
        if(numel(View) > 2)
            view(View(i, :));
        end

        % Add frame to AVI object
        if(~isempty(aviobj))
            frame = getframe(fig);
            aviobj = addframe(aviobj, frame);
        end

    end

    hold off;

    % Close AVI file
    if(~isempty(aviobj))
        aviobj = close(aviobj);
    end

end
其中可以通過更改PI部分參數,重力補償值和濾波頻率,來適應自己的信號。
如果想要了解更多細節獲得源程序,可以查看原官方資料網站:
http://x-io.co.uk/open-source-imu-and-ahrs-algorithms/
參考資料: 四元數參考 X-IO開源 矩陣乘法本質 Pixhawk四元數及姿態解算 Mahony算法