
【DB寶36】使用Docker分分鐘搭建漂亮的prometheus+grafana監控
阿新 • • 發佈:2021-02-01
[toc]
# 一、部署Prometheus+grafana環境
## 1.1、下載Prometheus+grafana映象
```sql
[root@docker36 ~]# docker pull registry.cn-hangzhou.aliyuncs.com/lhrbest/lhrprometheus:1.0
1.0: Pulling from lhrbest/lhrprometheus
c1e1cb5fc6d2: Already exists
d7889870c229: Pull complete
Digest: sha256:6d2aea56026f4fdb17554b5ad0842766cb8e99a492382b6553ab330d0eb19c4b
Status: Downloaded newer image for registry.cn-hangzhou.aliyuncs.com/lhrbest/lhrprometheus:1.0
registry.cn-hangzhou.aliyuncs.com/lhrbest/lhrprometheus:1.0
[root@docker36 ~]# docker tag registry.cn-hangzhou.aliyuncs.com/lhrbest/lhrprometheus:1.0 lhrbest/lhrprometheus:1.0
```
## 1.2、建立映象
```sql
[root@docker36 ~]# ip addr | grep 66
inet 192.168.66.36/24 brd 192.168.66.255 scope global edge0
[root@docker36 ~]# docker run -d --name lhrprometheus01 -h lhrprometheus01 \
> -p 2222:22 -p 23389:3389 -p 29090:9090 -p 29093:9093 -p 23000:3000 \
> --privileged=true lhrbest/lhrprometheus:1.0 \
> /usr/sbin/init
fed3d3ea7275ec337e305a76d5694473a2637be4c71d22e46e669a5ec3b39e57
[root@docker36 ~]# docker exec -it lhrprometheus01 bash
[root@lhrprometheus01 /]#
```
其中,9090是Prometheus的埠,3000是grafana的埠,3389是Linux遠端桌面的埠。
**在本文中,需要注意以下內容:**
1、在該映象中,已安裝了prometheus 2.23版本,grafana 7.3.6版本,alertmanager 0.21版本,node_exporter 1.0.1版本,mysqld_exporter 0.12.1版本,oracledb_exporter 0.2.9版本
2、192.168.66.36是Prometheus和grafana的IP地址
3、程式和預設埠對應關係
> 埠 程式
> 9090 prometheus
> 3000 grafana
> 9093 alter_manager
> 9100 node_exporter
> 9104 mysqld_exporter
> 9121 redis_exporter
> 9161 oracledb_exporter
## 1.3、瀏覽器訪問
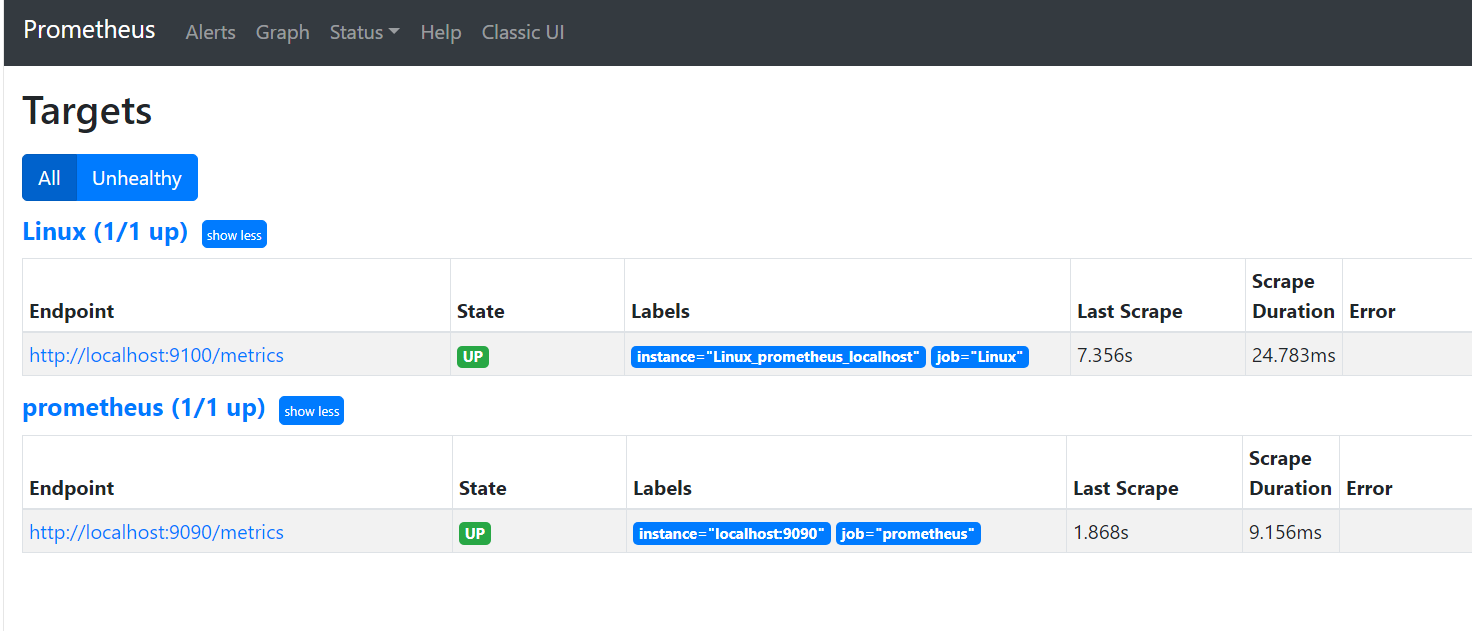
訪問普羅米修斯(Prometheus):http://192.168.66.36:29090/targets
訪問Grafana:http://192.168.66.36:23000 使用者名稱和密碼都是admin
預設的Linux系統監控可以看到如下介面:
# 二、監控Linux主機
## 2.1、在被監控主機上部署node_exporter軟體
需要在被監控的主機上安裝node_exporter軟體,下載地址:https://prometheus.io/download/
最新版本為:node_exporter-1.0.1.linux-amd64.tar.gz
或者直接將本機的/usr/local/bin/node_exporter檔案拷貝到需要被監控的主機上也可以。
假設我這裡需要被監控的主機為:121.36.8.186,那麼在該主機上執行如下命令:
```sql
nohup /usr/local/bin/node_exporter &
```
檢查,node_exporter預設埠為9100:
```sql
[root@ecs ~]# netstat -anp | grep 9100
tcp6 0 0 :::9100 :::* LISTEN 24995/node_exporter
tcp6 0 0 10.0.0.134:9100 210.52.224.155:58598 ESTABLISHED 24995/node_exporter
[root@ecs ~]# lsof -i:9100
COMMAND PID USER FD TYPE DEVICE SIZE/OFF NODE NAME
node_expo 24995 root 3u IPv6 8125597 0t0 TCP *:jetdirect (LISTEN)
node_expo 24995 root 8u IPv6 8203663 0t0 TCP ecs:jetdirect->210.52.224.155:58598 (ESTABLISHED)
```
命令列直接訪問:

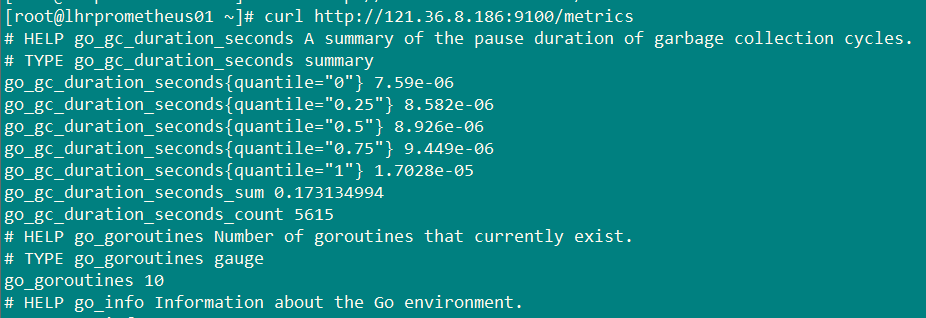
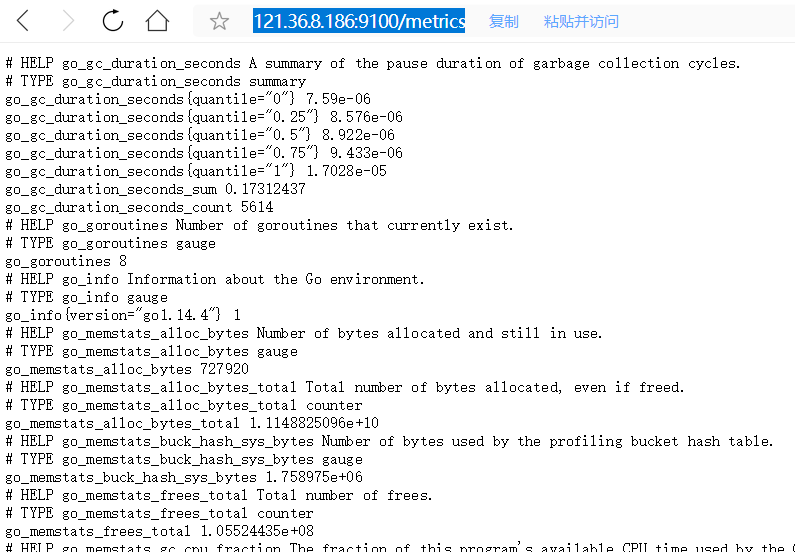
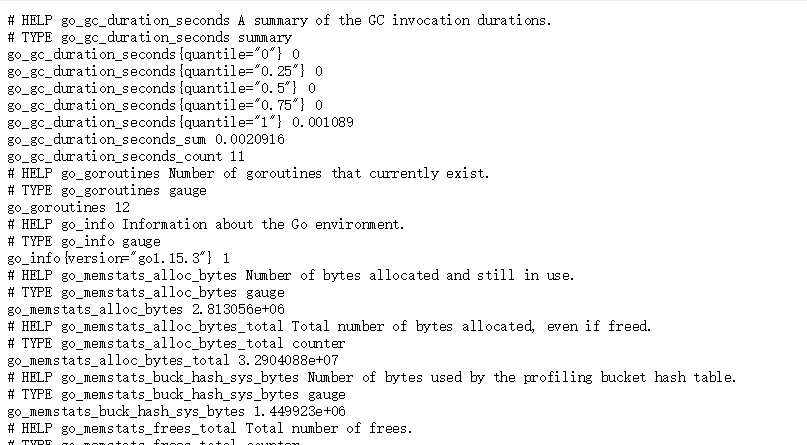
瀏覽器訪問http://121.36.8.186:9100/metrics ,返回:
## 2.2、修改prometheus的配置檔案
修改prometheus的配置檔案(/usr/local/prometheus/prometheus.yml),新增第6-8行:
```sql
- job_name: 'Linux'
static_configs:
- targets: ['localhost:9100']
labels:
instance: Linux_prometheus_localhost
- targets: ['121.36.8.186:9100']
labels:
instance: Linux_121.36.8.186
```
通過命令熱載入:
```sql
curl -XPOST http://localhost:9090/-/reload
```
## 2.3、瀏覽器訪問
此時再重新整理訪問:http://192.168.66.36:29090/targets
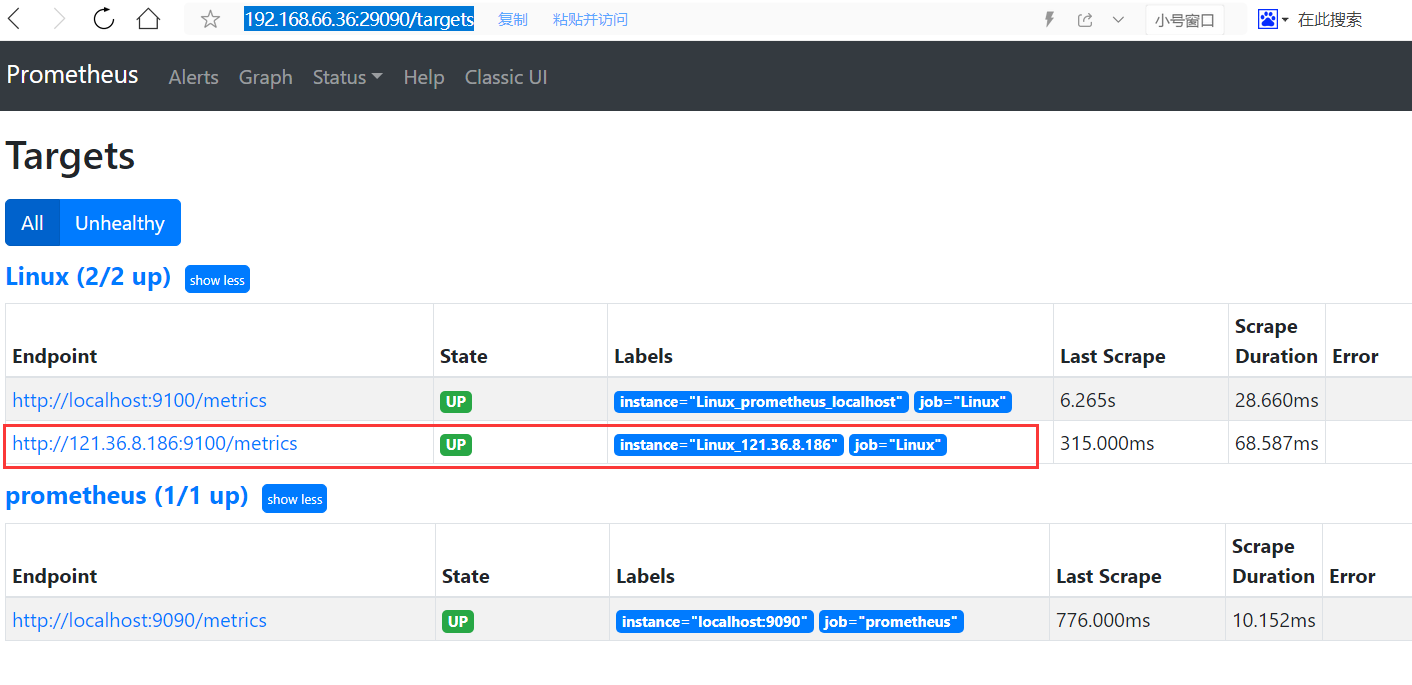
發現新主機已經被監控到了。此時再去grafana頁面查詢:
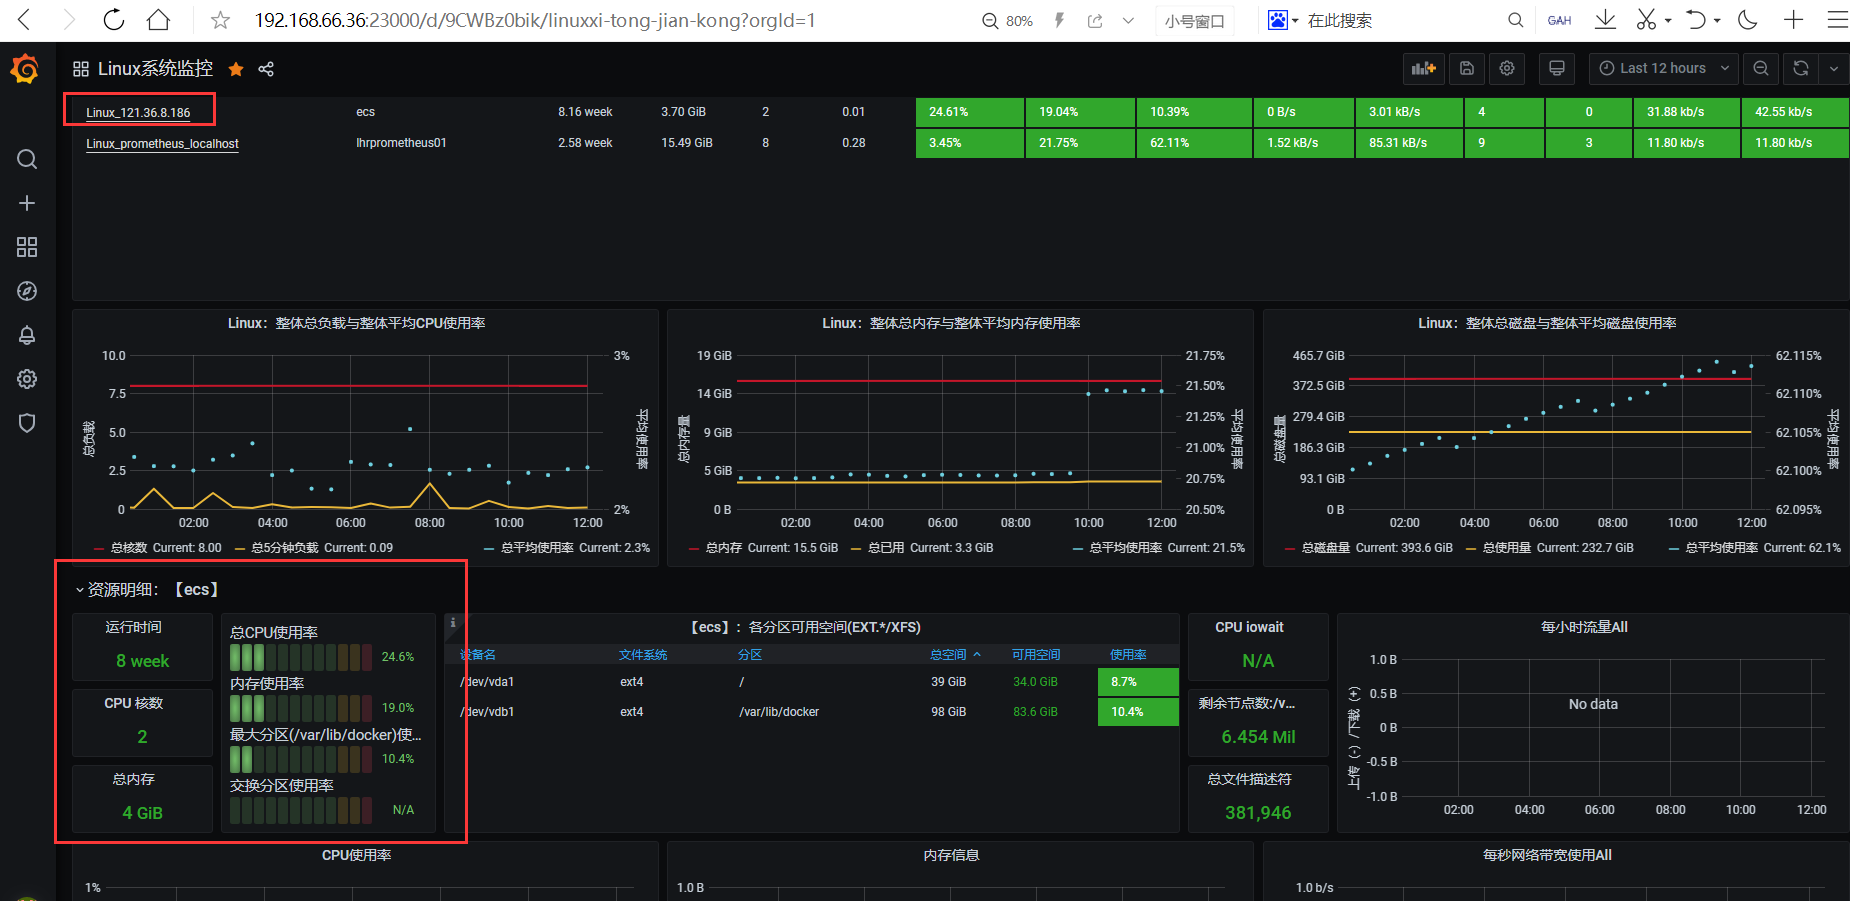
發現已經有資料了。
# 三、監控Windows主機
## 3.1、在被監控主機上部署wmi-exporter軟體
在需要被監控windows機器安裝wmi-exporter,下載節點監控程式並執行,預設埠9182,下載地址:https://github.com/martinlindhe/wmi_exporter
安裝完成後,預設安裝了service,軟體安裝路徑為:C:\Program Files\windows_exporter\
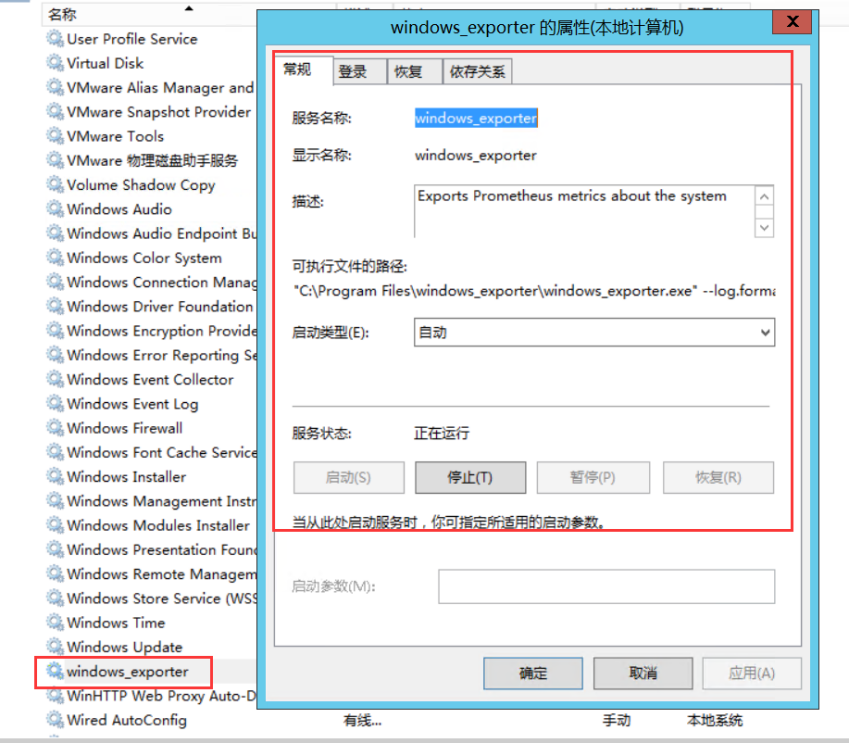
瀏覽器訪問:http://192.168.66.236:9182/metrics,出現如下資訊則,客戶端節點正常
## 3.2、修改prometheus的配置檔案
修改prometheus的配置檔案(/usr/local/prometheus/prometheus.yml),新增第1-3行:
```sql
- job_name: 'Windows'
static_configs:
- targets: ['192.168.66.236:9182']
```
通過命令熱載入:
```sql
curl -XPOST http://localhost:9090/-/reload
```
## 3.3、瀏覽器訪問
此時再重新整理訪問:http://192.168.66.36:29090/targets
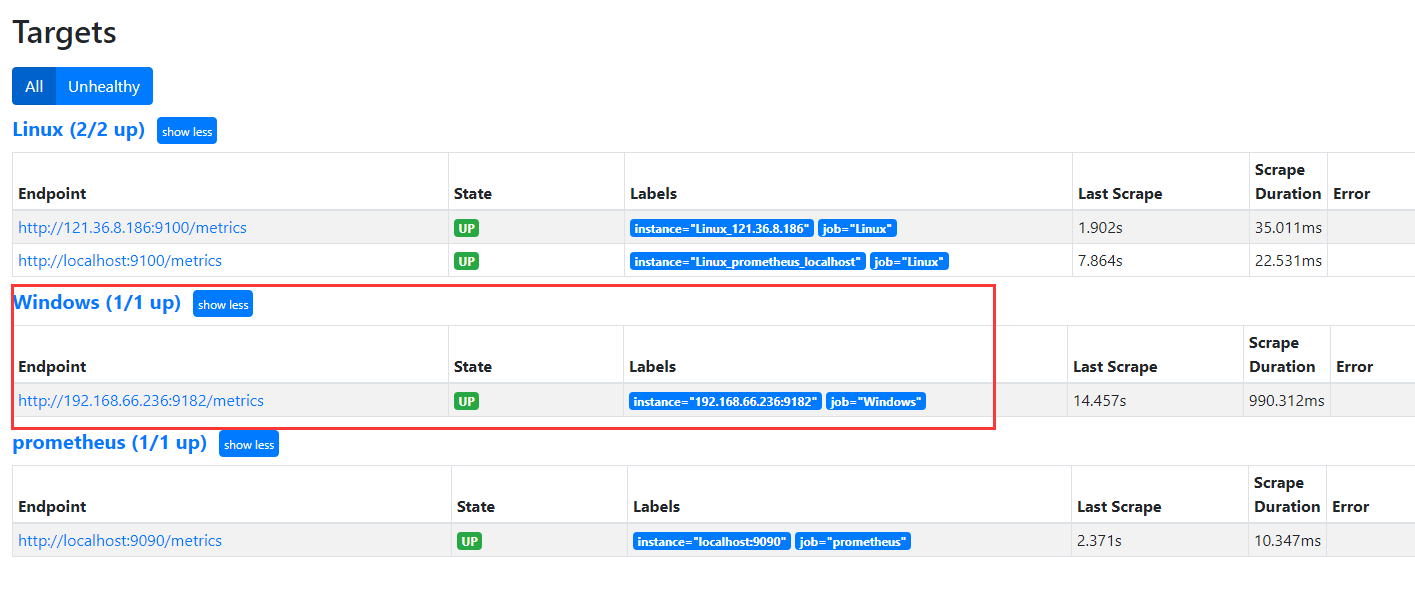
發現新主機已經被監控到了。此時再去grafana頁面查詢:

發現已經有資料了。
# 四、監控MySQL例項
## 4.1、配置被監控的MySQL例項
監控MySQL例項需要用到mysqld_exporter軟體,下載地址:https://prometheus.io/download/
監控MySQL例項可以分為2種部署方式:
**1、分離部署+環境變數**
這種方式是在每個mysql伺服器上跑一個exporter程式,比如10.10.20.14伺服器上跑自己的mysqld_exporter,而登到10.10.20.15伺服器上也啟動自己的mysqld_exporter,也就是分離部署,這樣的話每個mysql伺服器上除了mysqld程序外還會多一個mysqld_exporter的程序。部署方式(本文不使用這種方式):
```sql
export DATA_SOURCE_NAME='root:lhr@(192.168.66.35:3317)/'
nohup mysqld_exporter 1>/dev/null 2>&1 &
```
**2、集中部署+配置檔案**
如果我們想要保持mysql伺服器零入侵的純淨環境,這時候就可以嘗試一下集中部署+配置檔案的方式。集中部署,就是說我們將所有的mysqld_exporter部署在同一臺伺服器上,在這臺伺服器上對mysqld_exporter進行統一的管理。
本文,我們採用第2種方式部署。所以,直接在容器lhrprometheus01內進行配置:
```sql
mkdir -p /etc/mysqld_exporter/
cd /etc/mysqld_exporter/
cat > mysql573317.cnf << "EOF"
[client]
user=root
password=lhr
host=192.168.66.35
port=3317
EOF
cat > mysql803318.cnf << "EOF"
[client]
user=root
password=lhr
host=192.168.66.35
port=3318
EOF
unset DATA_SOURCE_NAME
nohup mysqld_exporter --web.listen-address=localhost:9104 --config.my-cnf=/etc/mysqld_exporter/mysql573317.cnf 1>