
linux下的核心測試工具——perf使用簡介
摘要:Perf是Linux kernel自帶的系統性能優化工具。Perf的優勢在於與Linux Kernel的緊密結合,它可以最先應用到加入Kernel的new feature。pef可以用於檢視熱點函式,檢視cashe miss的比率,從而幫助開發者來優化程式效能。
1.perf的安裝
由於我們經常是在自己編譯的核心上進行開發工作,這裡需要有包含調式資訊的核心啟動映象檔案vmlinux,在自定義核心的基礎之上,進入linux核心原始碼,linux/tools/perf
make
make install
提示:
1)可能在編譯的時候,有報錯大概是由於平臺問題,資料型別不匹配,導致所有的warning都被當作error對待:出現這問題的原因是-Werror這個gcc編譯選項。
2)安裝完畢,perf可執行程式往往位於當前目錄,可能不在系統的PATH路徑中,此時需要改變環境變數PATH
2.perf的執行原理
效能調優工具如 perf,Oprofile 等的基本原理都是對被監測物件進行取樣,最簡單的情形是根據 tick 中斷進行取樣,即在 tick 中斷內觸發取樣點,在取樣點裡判斷程式當時的上下文。假如一個程式 90% 的時間都花費在函式 foo() 上,那麼 90% 的取樣點都應該落在函式 foo() 的上下文中。運氣不可捉摸,但我想只要取樣頻率足夠高,取樣時間足夠長,那麼以上推論就比較可靠。因此,通過 tick 觸發取樣,我們便可以瞭解程式中哪些地方最耗時間,從而重點分析。
稍微擴充套件一下思路,就可以發現改變取樣的觸發條件使得我們可以獲得不同的統計資料:
以時間點 ( 如 tick) 作為事件觸發取樣便可以獲知程式執行時間的分佈。
以 cache miss 事件觸發取樣便可以知道 cache miss 的分佈,即 cache 失效經常發生在哪些程式程式碼中。如此等等。
因此讓我們先來了解一下 perf 中能夠觸發取樣的事件有哪些。
使用perf list(在root許可權下執行),可以列出所有的取樣事件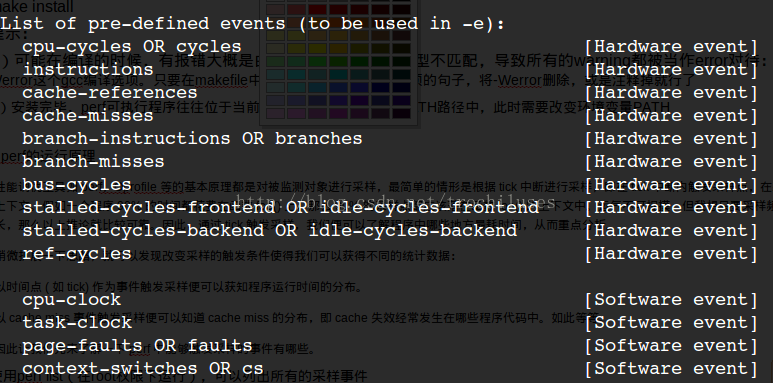
事件分為以下三種:
1)Hardware Event 是由 PMU 硬體產生的事件,比如 cache 命中,當您需要了解程式對硬體特性的使用情況時,便需要對這些事件進行取樣;
2)Software Event 是核心軟體產生的事件,比如程序切換,tick 數等 ;
3)Tracepoint event 是核心中的靜態 tracepoint 所觸發的事件,這些 tracepoint 用來判斷程式執行期間核心的行為細節,比如 slab 分配器的分配次數等。
上述每一個事件都可以用於取樣,並生成一項統計資料,時至今日,尚沒有文件對每一個 event 的含義進行詳細解釋。
3. perf stat——概覽程式的執行情況
面對一個問題程式,最好採用自頂向下的策略。先整體看看該程式執行時各種統計事件的大概,再針對某些方向深入細節。而不要一下子扎進瑣碎細節,會一葉障目的。
有些程式慢是因為計算量太大,其多數時間都應該在使用 CPU 進行計算,這叫做 CPU bound 型;有些程式慢是因為過多的 IO,這種時候其 CPU 利用率應該不高,這叫做 IO bound 型;對於 CPU bound 程式的調優和 IO bound 的調優是不同的。
如果您認同這些說法的話,Perf stat 應該是您最先使用的一個工具。它通過概括精簡的方式提供被除錯程式執行的整體情況和彙總資料。
本篇中,我們將在以後使用這個例子test1.c:
測試用例:test1
 //test.c
 void longa()
 {
   int i,j;
   for(i = 0; i < 1000000; i++)
   j=i; //am I silly or crazy? I feel boring and desperate.
 }

 void foo2()
 {
   int i;
   for(i=0 ; i < 10; i++)
        longa();
 }

 void foo1()
 {
   int i;
   for(i = 0; i< 100; i++)
      longa();
 }

 int main(void)
 {
   foo1();
   foo2();
 }
將它編譯為可執行檔案 test1
gcc – o test1 – g test.c
|
下面演示了 perf stat 針對程式 test1 的輸出:

結果分析:
對 test1進行調優應該要找到熱點 ( 即最耗時的程式碼片段 ),再看看是否能夠提高熱點程式碼的效率。
預設情況下,除了 task-clock-msecs 之外,perf stat 還給出了其他幾個最常用的統計資訊:
Task-clock-msecs:CPU 利用率,該值高,說明程式的多數時間花費在 CPU 計算上而非 IO。
Context-switches:程序切換次數,記錄了程式執行過程中發生了多少次程序切換,頻繁的程序切換是應該避免的。
Cache-misses:程式執行過程中總體的 cache 利用情況,如果該值過高,說明程式的 cache 利用不好
CPU-migrations:表示程序 t1 執行過程中發生了多少次 CPU 遷移,即被排程器從一個 CPU 轉移到另外一個 CPU 上執行。
Cycles:處理器時鐘,一條機器指令可能需要多個 cycles,
Instructions: 機器指令數目。
IPC:是 Instructions/Cycles 的比值,該值越大越好,說明程式充分利用了處理器的特性。
Cache-references: cache 命中的次數
Cache-misses: cache 失效的次數。
4.精確制導——定位程式瓶頸perf record && perf report
4.1查詢時間上的熱點函式
 perf record – e cpu-clock ./test1
 perf report
|
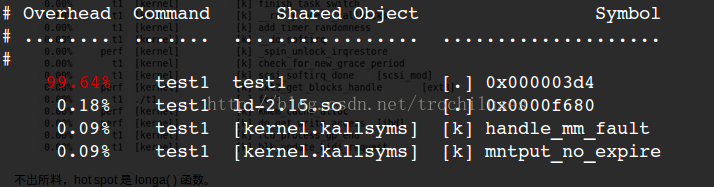
3個問題:
1)perf未能定位本地符號表對應的symbol和地址的對應關係:0x000003d4對應的什麼函式?
2)取樣頻率不夠高,失去了一些函式的資訊:顯然一些核心函式沒有顯示在上面的結果中,因為取樣頻率如果不夠高,那麼勢必會有一些函式中的取樣點沒有/
3)如何克服取樣的隨機性帶來的問題:為了在測量更加逼近正確值,我們採用多次重複取平均值的方法來逼近真實值。(這裡可以用-r來指定重複次數)
對於問題2),我們可以用perf record -F count 來指定取樣頻率加以解決:
root@hyk-linux:/home/hyk/program/cprogram# perf record -F 50000 -e cpu-clock ./test1
[ perf record: Woken up 3 times to write data ]
[ perf record: Captured and wrote 0.532 MB perf.data (~23245 samples) ]
root@hyk-linux:/home/hyk/program/cprogram# perf report
# ========
# captured on: Mon Aug 26 09:54:45 2013
# hostname : hyk-linux
# os release : 3.10.9
# perf version : 3.10.9
# arch : i686
# nrcpus online : 4
# nrcpus avail : 4
# cpudesc : Intel(R) Core(TM) i5-2430M CPU @ 2.40GHz
# cpuid : GenuineIntel,6,42,7
# total memory : 4084184 kB
# cmdline : /media/usr/src/linux-3.10.9/tools/perf/perf record -F 50000 -e cpu-c
# event : name = cpu-clock, type = 1, config = 0x0, config1 = 0x0, config2 = 0x0
# HEADER_CPU_TOPOLOGY info available, use -I to display
# pmu mappings: cpu = 4, software = 1, tracepoint = 2, uncore_cbox_0 = 6, uncore
# ========
#
# Samples: 13K of event 'cpu-clock'
# Event count (approx.): 273580000
#
# Overhead  Command      Shared Object                           Symbol
# ........  .......  .................  ...............................
#
    99.77%    test1  test1              [.] 0x000003c3
     0.07%    test1  ld-2.15.so         [.] 0x00004c99
     0.02%    test1  [kernel.kallsyms]  [k] __wake_up_bit
     0.01%    test1  [kernel.kallsyms]  [k] __kunmap_atomic
     0.01%    test1  [kernel.kallsyms]  [k] load_elf_binary
     0.01%    test1  [kernel.kallsyms]  [k] _raw_spin_unlock_irqrestore
     0.01%    test1  libc-2.15.so       [.] 0x00097d8e
     0.01%    test1  [kernel.kallsyms]  [k] exit_itimers
     0.01%    test1  [kernel.kallsyms]  [k] profile_munmap
     0.01%    test1  [kernel.kallsyms]  [k] get_page_from_freelist
     0.01%    test1  [kernel.kallsyms]  [k] vma_interval_tree_remove
     0.01%    test1  [kernel.kallsyms]  [k] change_protection
     0.01%    test1  [kernel.kallsyms]  [k] link_path_walk
     0.01%    test1  [kernel.kallsyms]  [k] prepend_path
     0.01%    test1  [kernel.kallsyms]  [k] __inode_wait_for_writeback
     0.01%    test1  [kernel.kallsyms]  [k] aa_free_task_context
     0.01%    test1  [kernel.kallsyms]  [k] radix_tree_lookup_element
     0.01%    test1  [kernel.kallsyms]  [k] _raw_spin_lock
結果解釋:
The column 'Overhead' indicates the percentage of the overall samples collected in the corresponding function. The second column reports the process from which the samples were collected. In per-thread/per-process mode, this is always the name of the monitored command. But in cpu-wide mode, the command can vary. The third column shows the name of the ELF image where the samples came from. If a program is dynamically linked, then this may show the name of a shared library. When the samples come from the kernel, then the pseudo ELF image name [kernel.kallsyms] is used. The fourth column indicates the privilege level at which the sample was taken, i.e. when the program was running when it was interrupted:
- [.] : user level
- [k]: kernel level
- [g]: guest kernel level (virtualization)
- [u]: guest os user space
- [H]: hypervisor
The final column shows the symbol name.
程式碼是非常複雜難說的,t1 程式中的 foo1() 也是一個潛在的調優物件,為什麼要呼叫 100 次那個無聊的 longa() 函式呢?但我們在上圖中無法發現 foo1 和 foo2,更無法瞭解他們的區別了。
我曾發現自己寫的一個程式居然有近一半的時間花費在 string 類的幾個方法上,string 是 C++ 標準,我絕不可能寫出比 STL 更好的程式碼了。因此我只有找到自己程式中過多使用 string 的地方。因此我很需要按照呼叫關係進行顯示的統計資訊。
使用 perf 的 -g 選項便可以得到需要的資訊:
perf record -g -e cpu-clock ./test1perf report
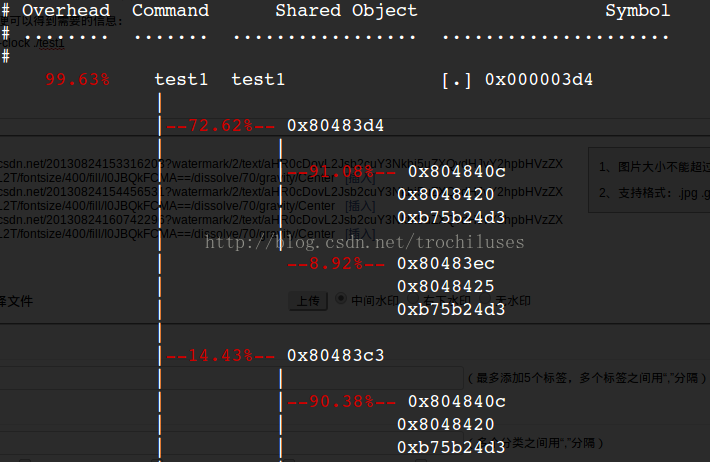
當然,這裡符號表沒有定位的問題有依然沒有解決!
perf record的其他引數:
-f:強制覆蓋產生的.data資料
-c:事件每發生count次取樣一次
-p:指定程序
-t:指定執行緒
4.2 perf report的相關引數:
-k:指定未經壓縮的核心映象檔案,從而獲得核心相關資訊
--report:cpu按照cpu列出負載
5.使用tracepoint
當 perf 根據 tick 時間點進行取樣後,人們便能夠得到核心程式碼中的 hot spot。那什麼時候需要使用 tracepoint 來取樣呢?
我想人們使用 tracepoint 的基本需求是對核心的執行時行為的關心,如前所述,有些核心開發人員需要專注於特定的子系統,比如記憶體管理模組。這便需要統計相關核心函式的執行情況。另外,核心行為對應用程式效能的影響也是不容忽視的:
以之前的遺憾為例,假如時光倒流,我想我要做的是統計該應用程式執行期間究竟發生了多少次系統呼叫。在哪裡發生的?
下面我用 ls 命令來演示 sys_enter 這個 tracepoint 的使用:
 [root@ovispoly /]# perf stat -e raw_syscalls:sys_enter ls
 bin dbg etc  lib  media opt root
				 selinux sys usr
 boot dev home lost+found mnt proc sbin srv
				 tmp var

  Performance counter stats for 'ls':

 101 raw_syscalls:sys_enter

  0.003434730 seconds time elapsed


 [root@ovispoly /]# perf record -e raw_syscalls:sys_enter ls

 [root@ovispoly /]# perf report
 Failed to open .lib/ld-2.12.so, continuing without symbols
 # Samples: 70
 #
 # Overhead Command Shared Object Symbol
 # ........ ............... ............... ......
 #
 97.14% ls ld-2.12.so [.] 0x0000000001629d
 2.86% ls [vdso] [.] 0x00000000421424
 #
 # (For a higher level overview, try: perf report --sort comm,dso)
 #
|
這個報告詳細說明了在 ls 執行期間發生了多少次系統呼叫 ( 上例中有 101 次 ),多數系統呼叫都發生在哪些地方 (97% 都發生在 ld-2.12.so 中 )。
有了這個報告,或許我能夠發現更多可以調優的地方。比如函式 foo() 中發生了過多的系統呼叫,那麼我就可以思考是否有辦法減少其中有些不必要的系統呼叫。
您可能會說 strace 也可以做同樣事情啊,的確,統計系統呼叫這件事完全可以用 strace 完成,但 perf 還可以幹些別的,您所需要的就是修改 -e 選項後的字串。
羅列 tracepoint 實在是不太地道,本文當然不會這麼做。但學習每一個 tracepoint 是有意義的,類似背單詞之於學習英語一樣,是一項緩慢痛苦卻不得不做的事情。
5.2同樣,我們跟蹤一下wirteback子系統的相關情況:
root@hyk-linux:/home/hyk/program/cprogram# perf record -e writeback:* lsa.out	       cscope.po.out  perf.data.old  t2.c  test1     testperf
cscope.in.out  malloc.c       t1	     tags  test1s    testperf.c
cscope.out     perf.data      t2	     test  test.img
[ perf record: Woken up 1 times to write data ]
[ perf record: Captured and wrote 0.013 MB perf.data (~548 samples) ]
root@hyk-linux:/home/hyk/program/cprogram# perf report
# ========
# captured on: Mon Aug 26 08:59:58 2013
# hostname : hyk-linux
# os release : 3.10.9
# perf version : 3.10.9
# arch : i686
# nrcpus online : 4
# nrcpus avail : 4
# cpudesc : Intel(R) Core(TM) i5-2430M CPU @ 2.40GHz
# cpuid : GenuineIntel,6,42,7
# total memory : 4084184 kB
# cmdline : /media/usr/src/linux-3.10.9/tools/perf/perf record -e writeback:* ls
# event : name = writeback:writeback_dirty_page, type = 2, config = 0x291, confi
# event : name = writeback:writeback_dirty_inode_start, type = 2, config = 0x290
# event : name = writeback:writeback_dirty_inode, type = 2, config = 0x28f, conf
# event : name = writeback:writeback_write_inode_start, type = 2, config = 0x28e
# event : name = writeback:writeback_write_inode, type = 2, config = 0x28d, conf
# event : name = writeback:writeback_queue, type = 2, config = 0x28c, config1 =
# event : name = writeback:writeback_exec, type = 2, config = 0x28b, config1 = 0
# event : name = writeback:writeback_start, type = 2, config = 0x28a, config1 =
# event : name = writeback:writeback_written, type = 2, config = 0x289, config1
# event : name = writeback:writeback_wait, type = 2, config = 0x288, config1 = 0
# event : name = writeback:writeback_pages_written, type = 2, config = 0x287, co
# event : name = writeback:writeback_nowork, type = 2, config = 0x286, config1 =
# event : name = writeback:writeback_wake_background, type = 2, config = 0x285,
# event : name = writeback:writeback_bdi_register, type = 2, config = 0x284, con
# event : name = writeback:writeback_bdi_unregister, type = 2, config = 0x283, c
# event : name = writeback:wbc_writepage, type = 2, config = 0x282, config1 = 0x
# event : name = writeback:writeback_queue_io, type = 2, config = 0x281, config1
# event : name = writeback:global_dirty_state, type = 2, config = 0x280, config1
# event : name = writeback:bdi_dirty_ratelimit, type = 2, config = 0x27f, config
# event : name = writeback:balance_dirty_pages, type = 2, config = 0x27e, config
# event : name = writeback:writeback_sb_inodes_requeue, type = 2, config = 0x27d
# event : name = writeback:writeback_congestion_wait, type = 2, config = 0x27c,
# event : name = writeback:writeback_wait_iff_congested, type = 2, config = 0x27
# event : name = writeback:writeback_single_inode_start, type = 2, config = 0x27
# event : name = writeback:writeback_single_inode, type = 2, config = 0x279, con
# HEADER_CPU_TOPOLOGY info available, use -I to display
# pmu mappings: cpu = 4, software = 1, tracepoint = 2, uncore_cbox_0 = 6, uncore
# ========
#
# Samples: 0  of event 'writeback:writeback_dirty_page'
# Event count (approx.): 0
#
# Overhead  Command  Shared Object  Symbol
# ........  .......  .............  ......
#


# Samples: 1  of event 'writeback:writeback_dirty_inode_start'
# Event count (approx.): 1
#
# Overhead  Command      Shared Object                  Symbol
# ........  .......  .................  ......................
#
   100.00%       ls  [kernel.kallsyms]  [k] __mark_inode_dirty


# Samples: 1  of event 'writeback:writeback_dirty_inode'
# Event count (approx.): 1
#
# Overhead  Command      Shared Object                  Symbol
# ........  .......  .................  ......................
#
   100.00%       ls  [kernel.kallsyms]  [k] __mark_inode_dirty


# Samples: 0  of event 'writeback:writeback_write_inode_start'
# Event count (approx.): 0
#
# Overhead  Command  Shared Object  Symbol
# ........  .......  .............  ......
#


# Samples: 0  of event 'writeback:writeback_write_inode'
# Event count (approx.): 0
#
# Overhead  Command  Shared Object  Symbol
# ........  .......  .............  ......
#


# Samples: 0  of event 'writeback:writeback_queue'
# Event count (approx.): 0
#
# Overhead  Command  Shared Object  Symbol
# ........  .......  .............  ......
#


# Samples: 0  of event 'writeback:writeback_exec'
# Event count (approx.): 0
#
# Overhead  Command  Shared Object  Symbol
# ........  .......  .............  ......
#


# Samples: 0  of event 'writeback:writeback_start'
# Event count (approx.): 0
#
# Overhead  Command  Shared Object  Symbol
# ........  .......  .............  ......
#


# Samples: 0  of event 'writeback:writeback_written'
# Event count (approx.): 0
#
# Overhead  Command  Shared Object  Symbol
# ........  .......  .............  ......
#


# Samples: 0  of event 'writeback:writeback_wait'
# Event count (approx.): 0
#
# Overhead  Command  Shared Object  Symbol
# ........  .......  .............  ......
#


# Samples: 0  of event 'writeback:writeback_pages_written'
# Event count (approx.): 0
#
# Overhead  Command  Shared Object  Symbol
# ........  .......  .............  ......
#


# Samples: 0  of event 'writeback:writeback_nowork'
# Event count (approx.): 0
#
# Overhead  Command  Shared Object  Symbol
# ........  .......  .............  ......
#


# Samples: 0  of event 'writeback:writeback_wake_background'
# Event count (approx.): 0
#
# Overhead  Command  Shared Object  Symbol
# ........  .......  .............  ......
#


# Samples: 0  of event 'writeback:writeback_bdi_register'
# Event count (approx.): 0
#
# Overhead  Command  Shared Object  Symbol
# ........  .......  .............  ......
#


# Samples: 0  of event 'writeback:writeback_bdi_unregister'
# Event count (approx.): 0
#
# Overhead  Command  Shared Object  Symbol
# ........  .......  .............  ......
#


# Samples: 0  of event 'writeback:wbc_writepage'
# Event count (approx.): 0
#
# Overhead  Command  Shared Object  Symbol
# ........  .......  .............  ......
#


# Samples: 0  of event 'writeback:writeback_queue_io'
# Event count (approx.): 0
#
# Overhead  Command  Shared Object  Symbol
# ........  .......  .............  ......
#


# Samples: 0  of event 'writeback:global_dirty_state'
# Event count (approx.): 0
#
# Overhead  Command  Shared Object  Symbol
# ........  .......  .............  ......
#


# Samples: 0  of event 'writeback:bdi_dirty_ratelimit'
# Event count (approx.): 0
#
# Overhead  Command  Shared Object  Symbol
# ........  .......  .............  ......
#


# Samples: 0  of event 'writeback:balance_dirty_pages'
# Event count (approx.): 0
#
# Overhead  Command  Shared Object  Symbol
# ........  .......  .............  ......
#


# Samples: 0  of event 'writeback:writeback_sb_inodes_requeue'
# Event count (approx.): 0
#
# Overhead  Command  Shared Object  Symbol
# ........  .......  .............  ......
#


# Samples: 0  of event 'writeback:writeback_congestion_wait'
# Event count (approx.): 0
#
# Overhead  Command  Shared Object  Symbol
# ........  .......  .............  ......
外部參考: