
使用apache JMeter進行web伺服器的效能/壓力/負載測試
Introduction
In this tutorial, we will go over how to use Apache JMeter to perform basic load and stress testing on your web application environment. We will show you how to use the graphical user interface to build a test plan and to run tests against a web server.
JMeter is an open source desktop Java application that is designed to load test and measure performance. It can be used to simulate loads of various scenarios and output performance data in several ways, including CSV and XML files, and graphs. Because it is 100% Java, it is available on every OS that supports Java 6 or later.
Prerequisites
In order to follow this tutorial, you will need to have a computer that you can run JMeter on, and a web server to load test against. Do not run these tests against your production servers unless you know they can handle the load, or you may negatively impact your server's performance.
You may adapt the tests in this tutorial to any of your own web applications. The web server that we are testing against as an example is a 1 CPU / 512 MB VPS running WordPress on a LEMP Stack, in the NYC2 DigitalOcean Datacenter. The JMeter computer is running in the DigitalOcean office in NYC (which is related to the latency of our tests).
Please note that the JMeter test results can be skewed by a variety of factors, including the system resources (CPU and RAM) available to JMeter and the network between JMeter and the web server being tested. The size of the load that JMeter can generate without skewing the results can be increased by running the tests in the non-graphical mode or by distributing the load generation to multiple JMeter servers.
Install JMeter
Because we are using Apache JMeter as a desktop application, and there are a large variety of desktop OSes in use, we will not cover the installation steps of JMeter for any specific OS. With that being said, JMeter is very easy to install. The easiest ways to install are to use a package manager (e.g. apt-get or Homebrew), or download and unarchive the JMeter binaries from the official site and install Java (version 6 or later).
Here is a list of the software, with links to archives, required to run JMeter:
Depending on how you install Java, you may need to add the Java bin directory to your PATHenvironmental variable, so JMeter can find the Java and keytool
binaries.
Also, we will refer to the path that you installed JMeter to (the directory that you unarchived it to) as$JMETER_HOME. Therefore, if you are on a Linux or
Unix-based OS, the JMeter binary is located at$JMETER_HOME/bin/jmeter. If you are running Windows, you can run $JMETER_HOME/bin/jmeter.bat.
For reference, when writing this tutorial, we used the following software versions:
- Oracle Java 7 update 60, 64-bit
- JMeter 2.11
Once you have JMeter installed and running, let's move on to building a test plan!
Building a Basic Test Plan
After starting JMeter, you should see the graphical user interface with an empty Test Plan:

A test plan is composed of a sequence of test components that determine how the load test will be simulated. We will explain the how some of these components can be used as we add them into our test plan.
Add a Thread Group
First, add a Thread Group to Test Plan:
- Right-click on Test Plan
- Mouse over Add >
- Mouse over Threads (Users) >
- Click on Thread Group
The Thread Group has three particularly important properties influence the load test:
- Number of Threads (users): The number of users that JMeter will attempt to simulate. Set this to 50
- Ramp-Up Period (in seconds): The duration of time that JMeter will distribute the start of the threads over. Set this to 10.
- Loop Count: The number of times to execute the test. Leave this set to 1.

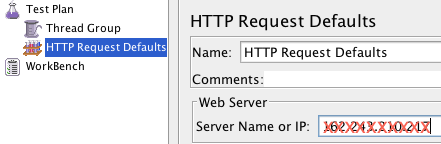
Add an HTTP Request Defaults
The HTTP Request Defaults Config Element is used to set default values for HTTP Requests in our test plan. This is particularly useful if we want to send multiple HTTP requests to the same server as part of our test. Now let's add HTTP Request Defaults to Thread Group:
- Select Thread Group, then Right-click it
- Mouse over Add >
- Mouse over Config Element >
- Click on HTTP Request Defaults
In HTTP Request Defaults, under the Web Server section, fill in the Server Name or IP field with the name or IP address of the web server you want to test. Setting the server here makes it the default server for the rest of the items in this thread group.
Add an HTTP Cookie Manager
If your web server uses cookies, you can add support for cookies by adding an HTTP Cookie Manager to the Thread Group:
- Select Thread Group, then Right-click it
- Mouse over Add >
- Mouse over Config Element >
- Click on HTTP Cookie Manager
Add an HTTP Request Sampler
Now you will want to add an HTTP Request sampler to Thread Group, which represents a page request that each thread (user) will access:
- Select Thread Group, then Right-click it
- Mouse over Add >
- Mouse over Sampler >
- Click on HTTP Request
In HTTP Request, under the HTTP Request section, fill in the Path with the item that you want each thread (user) to request. We will set this to /,
so each thread will access the homepage of our server. Note that you do not need to specify the server in this item because it was already specified in the HTTP Request Defaults item.
Note: If you want to add more HTTP Requests as part of your test, repeat this step. Every thread will perform all of the requests in this test plan.
Add a View Results in Table Listener
In JMeter, listeners are used to output the results of a load test. There are a variety of listeners available, and the other listeners can be added by installing plugins. We will use the Table because it is easy to read.
- Select Thread Group, then Right-click it
- Mouse over Add >
- Mouse over Listener >
- Click on View Results in Table
You may also type in a value for Filename to output the results to a CSV file.
Run the Basic Test Plan
Now that we have our basic test plan set up, let's run it and see the results.
First, save the test plan by clicking on File then Save, then specify your desired file name. Then select onView Results in Table in the left pane, then click Run from the main menu then click Start (or just click the green Start arrow below the main menu). You should see the test results in the table as the test is run like:

Interpreting the Results
You will probably see that the Status of all the requests is "Success" (indicated by a green triangle with a checkmark in it). After that, the columns that you are probably most interest in are the Sample Time (ms)and Latency (not displayed in example) columns.
- Latency: The number of milliseconds that elapsed between when JMeter sent the request and when an initial response was received
- Sample Time: The number of milliseconds that the server took to fully serve the request (response + latency)
According to the table that was generated, the range of Sample Time was 128-164 ms. This is a reasonable response time for a basic homepage (which was about 55 KB). If your web application server is not struggling for resources, as demonstrated in the example, your Sample Time will be influenced primarily by geographical distance (which generally increases latency) and the size of the requested item (which increases transfer time). Your personal results will vary from the example.
So, our server survived our simulation of 50 users accessing our 55 KB WordPress homepage over 10 seconds (5 every second), with an acceptable response. Let's see what happens when we increase the number of threads.
Increasing the Load
Let's try the same test with 80 threads over 10 seconds. In the Thread Group item in the left-pane, change the Number of Threads (users) to 80. Now click View Results in Table, then click Start. On our example server, this results in the following table:

As you can see, the sample time has increased to nearly a second, which indicates that our web application server is beginning to become overburdened by requests. Let's log in to our VPS and see take a quick look at resource usage during the load test.
Log in to your web server via SSH and run top:
top
Unless you have users actively hitting your server, you should see that the Cpu(s) % user usage (us) should be very low or 0%, and the Cpu(s) % idle (id) should be 99%+, like so:

Now, in JMeter, start the test again, then switch back to your web server's SSH session. You should see the resource usage increase:

In the case of our example, the CPU % user usage is 94% and the system usage (sy) is 4.7% with 0% idle. We aren't running out of memory, as indicated in the image above, so the decreased performance is due to lack of CPU power! We can also see that the php5-fpm processes, which are serving WordPress, are using is using the majority of the CPU (about 96% combined).
In order to meet the demands of this simulation of 80 users in 10 seconds, we need to either increase our CPU or optimize our server setup to use less CPU. In the case of WordPress, we could move the MySQL database (which uses portion of the CPU) to another server and we could also implement caching (which would decrease CPU usage).
If you are curious, you may adjust the number of threads in the test to see how many your server can handle before it begins to exhibit performance degradation. In the case of our 1 CPU droplet example, it works fine until we use 72 threads over 10 seconds.
Conclusion
JMeter can be a very valuable tool for determining how your web application server setup should be improved, to reduce bottlenecks and increase performance. Now that you are familiar with the basic usage of JMeter, feel free to create new test plans to measure the performance of your servers in various scenarios.
The test that we used as the example does not accurately reflect a normal user's usage pattern, but JMeter has the tools to perform a variety of tests that may be useful in your own environment. For example, JMeter can be configured to simulate a user logging into your application, client-side caching, and handling user sessions with URL rewriting. There are many other built-in samplers, listeners, and configuration tools that can help you build your desired scenario. Additionally, there are JMeter plugins to enhance its functionality that are available for download at http://jmeter-plugins.org/.
相關推薦
使用apache JMeter進行web伺服器的效能/壓力/負載測試
Introduction In this tutorial, we will go over how to use Apache JMeter to perform basic load and stress testing on your web applicat
Web伺服器效能壓力測試工具
一、http_load 程式非常小,解壓後也不到100K http_load以並行複用的方式執行,用以測試web伺服器的吞吐量與負載。 但是它不同於大多數壓力測試工具,它可以以一個單一的程序執行,一般不會把客戶機搞死。 還可以測試HTTPS類的網站請求。 下載地址:h
(Jmeter 五)JMeter監控web伺服器效能
Tomcat 伺服器是一個免費的開放原始碼的Web 應用伺服器,tomcat安裝與配置,參考:http://jingyan.baidu.com/article/870c6fc33e62bcb03fe4be90.html 使用jmeter的tomcat監視器功能,可以通過向t
九款Web伺服器效能壓力測試工具
一、http_load 程式非常小,解壓後也不到100K http_load以並行複用的方式執行,用以測試web伺服器的吞吐量與負載。 但是它不同於大多數壓力測試工具,它可以以一個單一的程序執行,一般不會把客戶機搞死。 還可以測試HTTPS類的網站請求。 下載地址:http_lo
Web伺服器效能/壓力測試工具http_load、webbench、ab、Siege使用教程
一、http_load 程式非常小,解壓後也不到100K http_load以並行複用的方式執行,用以測試web伺服器的吞吐量與負載。但是它不同於大多數壓力測試工 具,它可以以一個單一的程序執行,一般不會把客戶機搞死。還可以測試HTTPS類的網站請求。 命令格式
(轉) Web伺服器效能/壓力測試工具http_load、webbench、ab、Siege使用教程
一、http_load 程式非常小,解壓後也不到100K http_load以並行複用的方式執行,用以測試web伺服器的吞吐量與負載。但是它不同於大多數壓力測試工 具,它可以以一個單一的程序執行,一般不會把客戶機搞死。還可以測試HTTPS類的網站請求。 命令格式:ht
幾款Web伺服器效能壓力測試工具
一、http_load程式非常小,解壓後也不到100Khttp_load以並行複用的方式執行,用以測試web伺服器的吞吐量與負載。但是它不同於大多數壓力測試工具,它可以以一個單一的程序執行,一般不會把客戶機搞死。還可以測試HTTPS類的網站請求。下載地址:http_load-
[轉]Web伺服器效能/壓力測試工具http_load、webbench、ab、Siege使用教程
一、http_load 程式非常小,解壓後也不到100K http_load以並行複用的方式執行,用以測試web伺服器的吞吐量與負載。但是它不同於大多數壓力測試工 具,它可以以一個單一的程序執行,一般不會把客戶機搞死。還可以測試HTTPS類的網站請求。 命令格式:http
Apache Jmeter進行服務器壓力測試
windows blog ssp 項目 win 安裝 apache 中文 安裝jdk 1、前言 最近項目遇到一個問題:其他公司對接我們系統,請求量太大的時候,返回單給對方就是丟失格式,大概十幾萬中總有那麽十幾單會出現格式錯誤! 所以我們老大就叫我用apache jm
使用jmeter進行App伺服器壓力測試
如果請求伺服器資料使用的是https協議,下面的就不用看了,下面的做法不能對於https請求做壓力測試。首先,沒有jmeter相關軟體的同學可以在這裡下載:jmeter。1、開啟jmeter,在測試計劃中新建一個執行緒組,該執行緒組可以不用設定。2、在工作臺中新建一個HTTP
web伺服器效能測試之利器—apache的ab
最近對效能測試產生了莫名其妙極其深厚的興趣,在這裡我想把我的學習過程記錄下來,希望能給未來的我後者現在的你提供一些幫助,如果有志同道合的人&不嫌棄我初出茅廬,和我聯絡,我非常願意和你交流關於伺服器效能方面的知識 測試工具選擇 在做所有優化之前,我們得有一個測試工具
使用JMeter進行Web 效能測試
1. 檢查點 JMeter通過斷言元件來實現測試結果正確性驗證。斷言元件獲取伺服器的響應資料,根據斷言規則匹配這些響應資料,匹配到,正常;匹配不到,則斷定為失敗。下面的例子是通過響應斷言判斷使用者是否登入成功,登入成功後,響應的資料,即html中有一個 <a id=
使用apache-jmeter進行壓力測試
The Apache JMeter™ application is open source software, a 100% pure Java application designed to l
在效能測試時使用nmon進行監控伺服器效能
在使用Jmeter進行效能測試,可以使用nmon進行伺服器的監控。 一、nmon說明 nmon分為工具包和分析包(nmonanalyser) nmon安裝很簡單,根據伺服器版本,下載相應的版本後,進行安裝即可。 二、nmon監聽 1、實時監聽 在nmon安裝目錄下,使用./nmon啟動nm
如何進行web前端效能優化
這裡是修真院前端小課堂,每篇分享文從 【背景介紹】【知識剖析】【常見問題】【解決方案】【編碼實戰】【擴充套件思考】【更多討論】【參考文獻】 八個方面深度解析前端知識/技能,本篇分享的是: 【如何進行web前端效能優化】 大家好,我是IT修真院深圳分院第9期的學員
測定Web伺服器效能
ApacheTop 簡介 ApacheTop是一個實時訪問的日誌檔案分析器,它的行為方式類似於對訪問日誌進行跟蹤,也提供一定程度的分析 安裝 yum install apachetop 使用 -f <file> 分析檔案 eg:apachet
5.11.6 jmeter元件-監聽器—伺服器效能監控PerfMon Metrics Collector
伺服器效能監控PerfMon Metrics Collector 在效能測試時,瞭解載入的伺服器的健康狀況是很重要的。使用.jp@gc - PerfMon Metrics Collector,你可以監視幾乎所有的平臺的CPU,記憶體,交換,磁碟I/O和網路I/O
apache-jmeter-3.1的簡單壓力測試使用方法
壓力測試工具LoadRunner是收費的,而且操作複雜。作為開發人員當然是用apache提供的jmeter,免費容易上手。 jmeter下載地址http://jmeter.apache.org/首先下載解壓到某個盤,我放在了D盤 然後配置環境變數:
ngnix、lighttpd、apache三大主流web伺服器的區別
(1). lighttpd Lighttpd是一個具有非常低的記憶體開銷,cpu佔用率低,效能好,以及豐富的模組等特點。lighttpd是眾多OpenSource輕量級的web server中較為優秀的一個。支援FastCGI, CGI, Auth, 輸出壓縮(outpu
用jmeter進行多使用者併發壓力測試
近日manager要求對專案進行壓力測試,開始對jmeter進行了研究。jmeter是Apache一個開源專案,可對各種專案進行測試,甚至包括junit。 測試要求如下,多使用者同時登陸web應用程式,並進行操作,檢視在多使用者操作下,程式的performe