
Python3——處理.CSV檔案格式的資料並用matplotlib視覺化
阿新 • • 發佈:2019-01-09
處理CSV檔案格式的資料
highs_lows.py
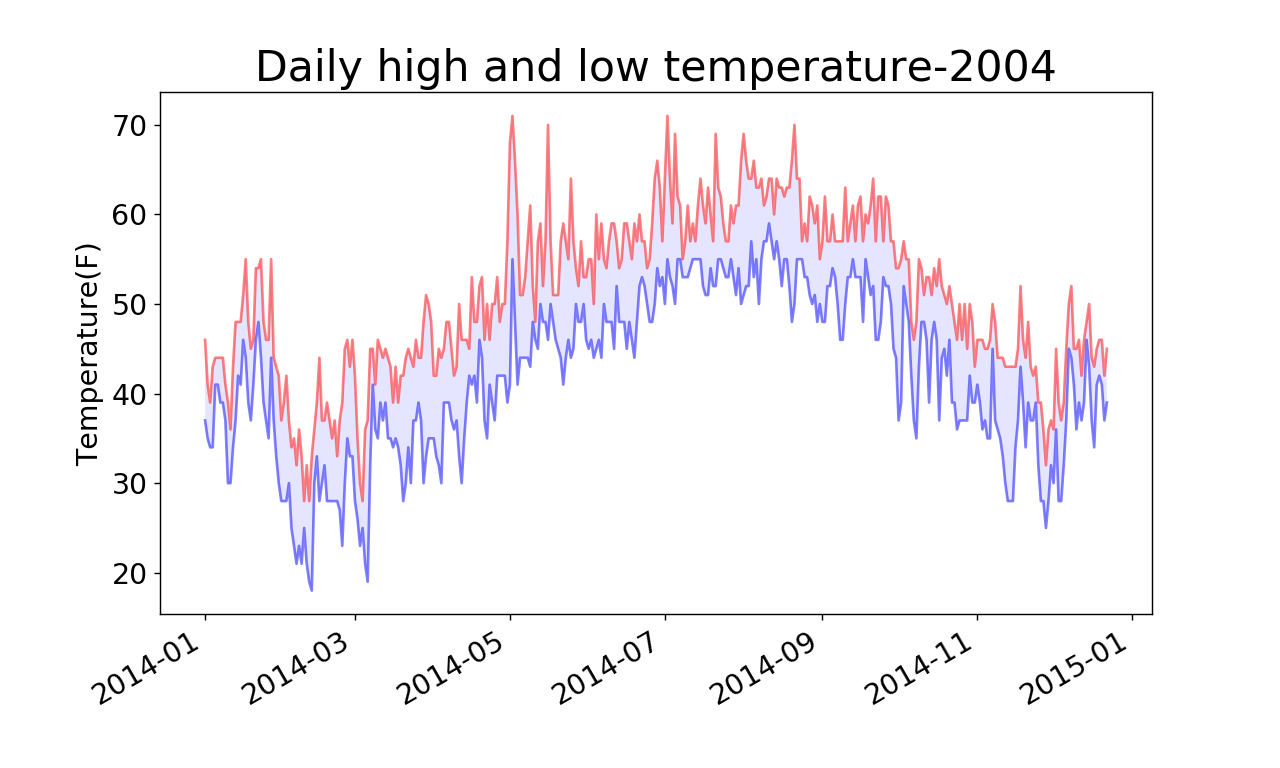
import csv
from matplotlib import pyplot as plt
from datetime import datetime
#讀取CSV檔案資料
filename='sitka_weather_2014.csv'
with open(filename) as f: #開啟這個檔案,並將結果檔案物件儲存在f中
    reader=csv.reader(f)  #建立一個閱讀器reader
    header_row=next(reader) #返回檔案中的下一行
    dates,highs,lows=[],[],[]      #宣告儲存日期,最值的列表
    for row in reader:
        current_date=datetime.strptime(row[0],'%Y-%m-%d')  #將日期資料轉換為datetime物件
        dates.append(current_date)    #儲存日期
        high=int(row[1])    #將字串轉換為數字
        highs.append(high)   #儲存溫度最大值
        low=int(row[3])
        lows.append(low)    #儲存溫度最小值

#根據資料繪製圖形
fig=plt.figure(dpi=128,figsize=(10,6))
plt.plot(dates,highs,c='red',alpha=0.5)#實參alpha指定顏色的透明度,0表示完全透明,1(預設值)完全不透明
plt.plot(dates,lows,c='blue',alpha=0.5)
plt.fill_between(dates,highs,lows,facecolor='blue',alpha=0.1) #給圖表區域填充顏色
plt.title('Daily high and low temperature-2004',fontsize=24)
plt.xlabel('',fontsize=16)
plt.ylabel('Temperature(F)',fontsize=16)
plt.tick_params(axis='both',which='major',labelsize=16)
fig.autofmt_xdate()  #繪製斜的日期標籤
plt.show()
sitka_weather_2014.csv 資料集檔案
連結:https://pan.baidu.com/s/1lIsySGvjsoONGDLyaR39TQ 密碼:5on4