
稀疏表示字典的顯示(MATLAB實現程式碼)
阿新 • • 發佈:2019-01-09
本文主要是實現論文--基於稀疏表示的影象超解析度《Image Super-Resolution Via Sparse Representation》中的Figure2,通過對100000個高解析度和低解析度影象塊訓練得到的高解析度影象塊字典,字典原子總數為512,影象塊尺寸大小為9X9

方法一:
clc;
clear all;

% load dictionary
load('Dictionary/D_512_0.15_9.mat');

patch_size=9;
nRow=24;
nCol=22;
D=Dh';
w=nCol*patch_size;
h=nRow*patch_size;

gridx = 1:patch_size :w;
gridx = [gridx, w-patch_size+1];
gridy = 1:patch_size : h;
gridy = [gridy, h-patch_size+1];
K=512; %字典原子總數
DD=cell(1,K);
row=length(gridx);
col=length(gridy);
hIm=zeros([w,h]);
for i=1:K
    DD{i}=D(i,:);
end

for ii = 1:length(gridx),
    for jj = 1:length(gridy),
        yy = gridx(ii);
        xx = gridy(jj);
        if (ii-1)*nRow+jj >K
            break
        end
        temp=DD{(ii-1)*nCol+jj};
        hPatch=reshape(temp,[patch_size,patch_size]);
        hIm(yy:yy+patch_size-1, xx:xx+patch_size-1) = hIm(yy:yy+patch_size-1, xx:xx+patch_size-1) +hPatch;
     end
end

figure;
imagesc(hIm);
colormap(gray);
axis image;
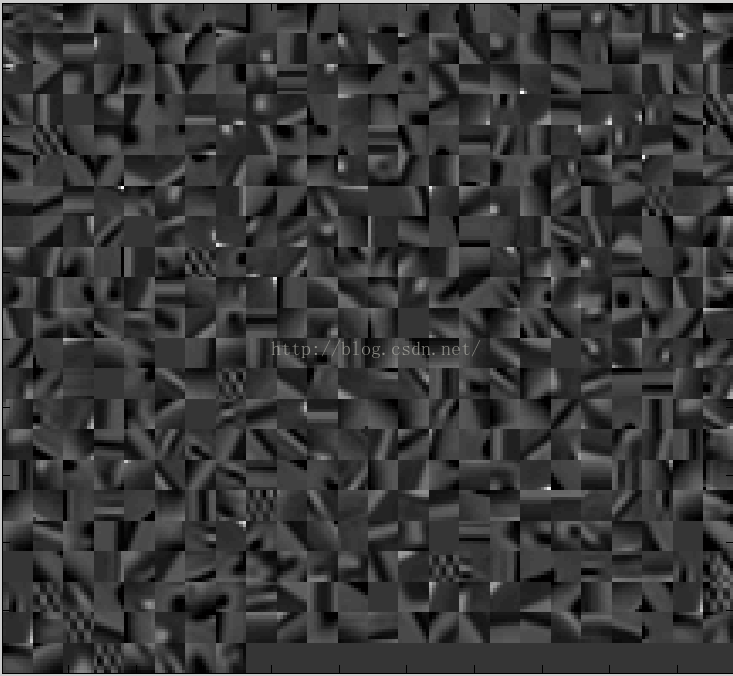
輸出結果:

可以看出,相比於論文中字典的顯示圖,顏色有點淺,通過調節MATLAB的colorbar,可以將背景顏色變深,
結果如下圖所示:


方法二:
通過http://www.cs.technion.ac.il/~elad/software/提供的ksvd工具箱中的displayDictionaryElementsAsImage( )函式,來實現字典的顯示。
displayDictionaryElementsAsImage.m
function I = displayDictionaryElementsAsImage2(D, numRows, numCols,X,Y,sortVarFlag)
% function I = displayDictionaryElementsAsImage(D, numRows, numCols, X,Y)
% displays the dictionary atoms as blocks. For activation, the dictionary D
% should be given, as also the number of rows (numRows) and columns
% (numCols) for the atoms to be displayed. X and Y are the dimensions of
% each atom.

borderSize = 1;
columnScanFlag = 1;
strechEachVecFlag = 1;
showImFlag = 1;

if (length(who('X'))==0)
    X = 8;
    Y = 8;
end
if (length(who('sortVarFlag'))==0)
    sortVarFlag = 1;
end

numElems = size(D,2);
if (length(who('numRows'))==0)
    numRows = floor(sqrt(numElems));
    numCols = numRows;
end
if (length(who('strechEachVecFlag'))==0)
    strechEachVecFlag = 0;
end
if (length(who('showImFlag'))==0)
    showImFlag = 1;
end

%%% sort the elements, if necessary.
%%% construct the image to display (I)
sizeForEachImage = sqrt(size(D,1))+borderSize;
I = zeros(sizeForEachImage*numRows+borderSize,sizeForEachImage*numCols+borderSize,3);
%%% fill all this image in blue
I(:,:,1) = 1; %min(min(D));
I(:,:,2) = 1; %min(min(D));
I(:,:,3) = 1; %max(max(D));
% %%% fill all this image in blue
% I(:,:,1) = 0; %min(min(D));
% I(:,:,2) = 0; %min(min(D));
% I(:,:,3) = 1; %max(max(D));

%%% now fill the image squares with the elements (in row scan or column
%%% scan).
if (strechEachVecFlag)
    for counter = 1:size(D,2)
        D(:,counter) = D(:,counter)-min(D(:,counter));
        if (max(D(:,counter)))
            D(:,counter) = D(:,counter)./max(D(:,counter));
        end
    end
end


if (sortVarFlag)
    vars = var(D);
    [V,indices] = sort(vars');
    indices = fliplr(indices);
    D = [D(:,1:sortVarFlag-1),D(:,indices+sortVarFlag-1)];
    signs = sign(D(1,:));
    signs(find(signs==0)) = 1;
    D = D.*repmat(signs,size(D,1),1);
    D = D(:,1:numRows*numCols);
end

counter=1;
for j = 1:numRows
    for i = 1:numCols
%         if (strechEachVecFlag)
%             D(:,counter) = D(:,counter)-min(D(:,counter));
%             D(:,counter) = D(:,counter)./max(D(:,counter));
%         end
%         if (columnScanFlag==1)
%             I(borderSize+(i-1)*sizeForEachImage+1:i*sizeForEachImage,borderSize+(j-1)*sizeForEachImage+1:j*sizeForEachImage,1)=reshape(D(:,counter),8,8);
%             I(borderSize+(i-1)*sizeForEachImage+1:i*sizeForEachImage,borderSize+(j-1)*sizeForEachImage+1:j*sizeForEachImage,2)=reshape(D(:,counter),8,8);
%             I(borderSize+(i-1)*sizeForEachImage+1:i*sizeForEachImage,borderSize+(j-1)*sizeForEachImage+1:j*sizeForEachImage,3)=reshape(D(:,counter),8,8);
%         else
            % Go in Column Scan:
            I(borderSize+(j-1)*sizeForEachImage+1:j*sizeForEachImage,borderSize+(i-1)*sizeForEachImage+1:i*sizeForEachImage,1)=reshape(D(:,counter),X,Y);
            I(borderSize+(j-1)*sizeForEachImage+1:j*sizeForEachImage,borderSize+(i-1)*sizeForEachImage+1:i*sizeForEachImage,2)=reshape(D(:,counter),X,Y);
            I(borderSize+(j-1)*sizeForEachImage+1:j*sizeForEachImage,borderSize+(i-1)*sizeForEachImage+1:i*sizeForEachImage,3)=reshape(D(:,counter),X,Y);
%         end
        counter = counter+1;
    end
end

if (showImFlag)
    I = I-min(min(min(I)));
    I = I./max(max(max(I)));
    imshow(I,[]);
end
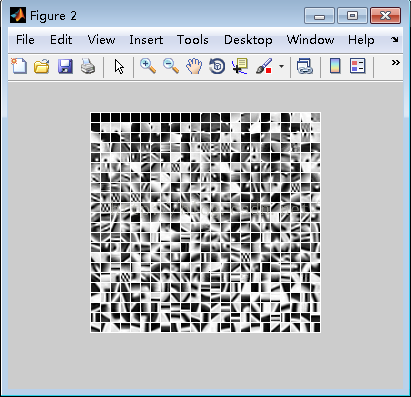
測試程式
displayDictionary_test.m
clc;
clear all;

%載入字典
load('F:\Research\ScSR\ScSR\Dictionary\D_512_0.15_9.mat');

patch_size=9;
D=Dh;
K=512;
figure;
%呼叫KSVD工具箱中的字典顯示函式
im=displayDictionaryElementsAsImage(D, floor(sqrt(K)), floor(size(D,2)/floor(sqrt(K))),patch_size,patch_size);
輸出結果:

方法三:
因為方法一顯示的字典影象偏灰,對比度不強,所以通過對字典原子畫素值進行拉伸變化到0-1,增強影象對比度。
clc;
clear all;

% load dictionary
load('Dictionary/D_512_0.15_9.mat');

patch_size=9;
nRow=24;
nCol=22;
D=Dh';
w=nCol*patch_size;
h=nRow*patch_size;

gridx = 1:patch_size :w;
gridx = [gridx, w-patch_size+1];
gridy = 1:patch_size : h;
gridy = [gridy, h-patch_size+1];
K=512; %字典原子總數
DD=cell(1,K);
row=length(gridx);
col=length(gridy);
hIm=zeros([w,h]);
for i=1:K
    DD{i}=D(i,:);
end

for ii = 1:length(gridx),
    for jj = 1:length(gridy),
        yy = gridx(ii);
        xx = gridy(jj);
        if (ii-1)*nRow+jj >K
            break
        end
        temp=DD{(ii-1)*nCol+jj};
        hPatch=reshape(temp,[patch_size,patch_size]);
        I=hPatch;
        I = I-min(min(min(I)));
        I = I./max(max(max(I)));%對字典原子畫素值進行拉伸變化到0-1
        hIm(yy:yy+patch_size-1, xx:xx+patch_size-1) = hIm(yy:yy+patch_size-1, xx:xx+patch_size-1) +I;
     end
end

figure;
imshow(hIm);
調整引數,將字典原子畫素值拉伸變換到0-0.7
        hPatch=reshape(temp,[patch_size,patch_size]);
        I=hPatch;
        I = I-min(min(min(I)));
I = 0.7*I./max(max(max(I)));%對字典原子畫素值進行拉伸變化到0-0.7 