
南方還未下雪,你是否知道中國哪10個城市最冷?python給你答案!

閱讀文字大概需要 7 分鐘。
01
抓取目標
這次我們的目標是爬取全國最冷的 10 座城市。
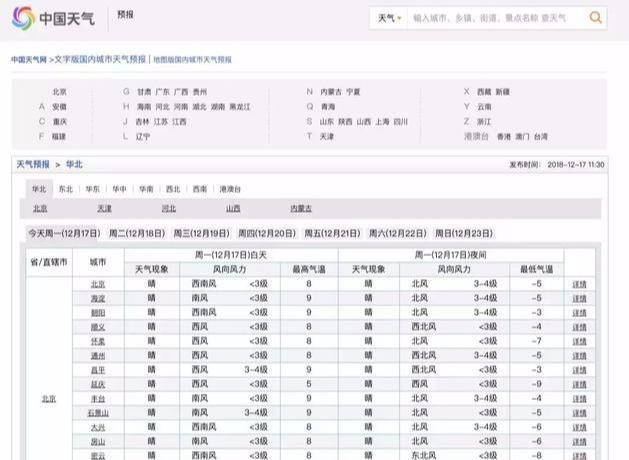
首先開啟目標網站 - 中國天氣網。
學習Python中有不明白推薦加入交流群
號:960410445
群裡有志同道合的小夥伴,互幫互助,
群裡有不錯的視訊學習教程和PDF!
我們要爬取全國所有城市的 溫度,然後獲取溫度最低的 10 個城市,再繪製成餅狀圖。

02
準備工作
由於爬取的資料少,考慮使用「 美味湯 - beautiful soup 」的方式來爬取。
另外,最後需要根據資料生成餅狀圖,需要安裝「 pyecharts 」及相容庫,不然控制檯會報錯。
# 安裝美味湯
pip3 install bs4
# html5lib 提升相容性
pip3 install html5lib
# 安裝圖形庫
pip3 install pyecharts
# 安裝圖形相容庫
pip3 install pyecharts-snapshot
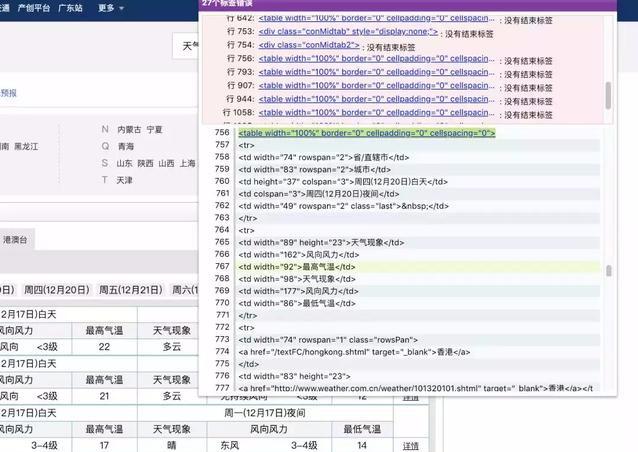
注意:一般爬蟲使用 lxml 去解析,但是由於中國天氣網的「 港澳臺 」頁面原始碼中存在很多標籤沒有正確關閉,因此使用 html5lib 的方式去解析資料。
03
爬取思路
首先,我們可以看到全國分為華北、東北、華東、華中、華南、西北、西南、港澳臺,8 個區域來展示天氣資料。
# 一共8個區域,包含:華北、東北、華東、華中、華南、西北、西南、港澳臺
# 華北
url_hb = 'http://www.weather.com.cn/textFC/hb.shtml'
# 東北
url_db = 'http://www.weather.com.cn/textFC/db.shtml'
# 華東
url_hd = 'http://www.weather.com.cn/textFC/hd.shtml'
# 華中
url_hz = 'http://www.weather.com.cn/textFC/hz.shtml'
# 華南
url_hn = 'http://www.weather.com.cn/textFC/hn.shtml'
# 西北
url_xb = 'http://www.weather.com.cn/textFC/xb.shtml'
# 西南
url_xn = 'http://www.weather.com.cn/textFC/xn.shtml'
# 港澳臺【比較特殊】
url_gat = 'http://www.weather.com.cn/textFC/gat.shtml'
我們首先需要去獲取每一個區域下所有城市的天氣資料,然後再對資料進行整理排序,寫入到圖形檔案中。
04
程式碼實現
首先爬取「 華北地區 」城市的天氣資料。
可以獲取到下面的規律:
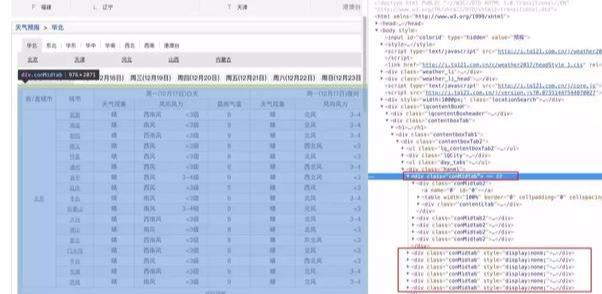
所有的「 class=conMidtab 」的 6 個 div 儲存著華北地區所有城市,包含今天以內未來一週的天氣資料。
每一個「 class=conMidtab2 」的 div 代表了一個省份的天氣資訊。
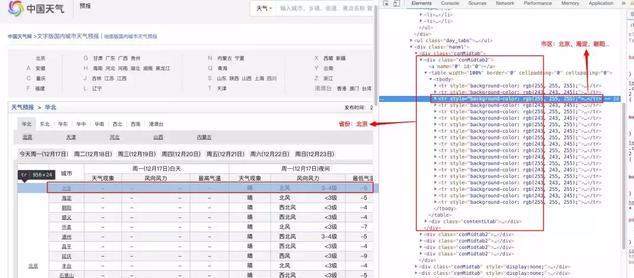
省份下面的城市天氣資料,都包含 table 標籤下。從第 3 個 tr 標籤開始,是每一個城市的天氣資料。
soup = BeautifulSoup(text, 'html5lib')
div_conMidtab = soup.find('div', class_='conMidtab')
# 3.獲取所有的table子Tag【天氣資訊都儲存在table標籤下面】
tables = div_conMidtab.find_all('table')
# 4.遍歷片區下面的省份
for table in tables:
 # 4.1過濾掉表頭的兩個tr資料
 trs = table.find_all('tr')[2:]
 # 5.遍歷省份下面的市區
 for index, tr in enumerate(trs):
 tds = tr.find_all('td')
 # 5.1 城市名稱【第 1 個td標籤】
 # 注意:一個省份第一個城市取第 2 個td標籤;其餘城市取第 1 個td標籤
 city_td = tds[1] if index == 0 else tds[0]
 city = list(city_td.stripped_strings)[0]
 # 5.2 最低氣溫【倒數第 2 個td標籤】
 temp_low_td = tds[-2]
 temp_low = list(temp_low_td.stripped_strings)[0]
 ALL_DATA.append({"city": city, "temp_low": int(temp_low)})
接下來,迴圈全國 8 個區域的列表,獲取所有城市的名稱和溫度資料。
for index, url in enumerate(url_areas):
 print('開始爬取第{}個區域'.format(index + 1))
 parse_page(url)
 time.sleep(1)
然後拿到所有城市和溫度的列表資料後,就可以對資料按溫度進行「 升序 」排列。
def analysis_data():
 """
 分析爬下來的資料
 :return:
 """
 # 1.預設的排序方式是升序【通過最低氣溫進行排序】
 ALL_DATA.sort(key=lambda data: data['temp_low'])
 # 2.獲取前面10條資料
 top_10 = ALL_DATA[:10]
 return top_10
最後,將資料寫入到餅狀圖中。
def show_with_chart(top_10):
 """
 10個城市和溫度生成餅狀圖
 :param top_10:
 :return:
 """
 # 把列表tip_10中的每一項拿出去放到匿名函式中,然後組裝成新的一個列表
 # 1.獲取城市列表
 citys = list(map(lambda item: item['city'], top_10))
 # 2.最低溫度列表
 temp_lows = list(map(lambda item: item['temp_low'], top_10))
 # 3.生成餅狀圖並寫入到html檔案中
 bar = Bar("最低氣溫排行榜")
 bar.add("最低溫度", citys, temp_lows)
 # 渲染
 bar.render('temperature.html')
05
爬取結果
最後開啟生成的餅狀圖,就能很直觀的檢視到今天溫度最低的 10 個城市。