
一文學會目前最火熱的大資料技術
阿新 • • 發佈:2018-12-17
**歡迎大家前往[騰訊雲+社群](https://cloud.tencent.com/developer/?fromSource=waitui),獲取更多騰訊海量技術實踐乾貨哦~**
> 本文由[michelmu](https://cloud.tencent.com/developer/user/1330019?fromSource=waitui)發表於[雲+社群專欄](https://cloud.tencent.com/developer/column/4008?fromSource=waitui)
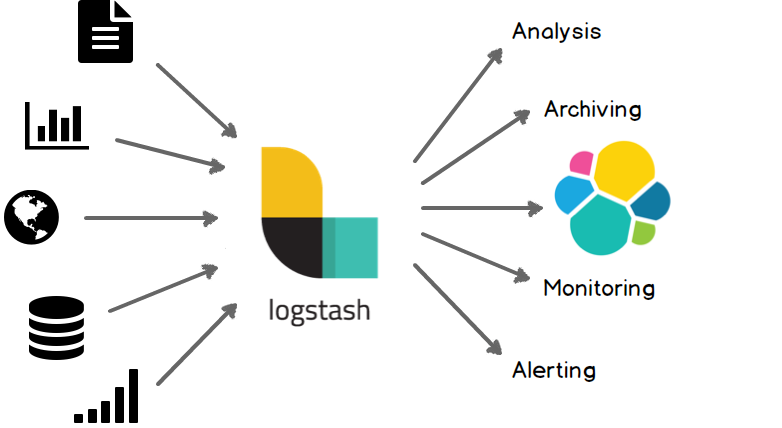
**Elasticsearch**是當前主流的分散式大資料儲存和搜尋引擎,可以為使用者提供強大的全文字檢索能力,廣泛應用於日誌檢索,全站搜尋等領域。**Logstash**作為Elasicsearch常用的實時資料採集引擎,可以採集來自不同資料來源的資料,並對資料進行處理後輸出到多種輸出源,是Elastic Stack 的重要組成部分。本文從Logstash的工作原理,使用示例,部署方式及效能調優等方面入手,為大家提供一個快速入門Logstash的方式。文章最後也給出了一些深入瞭解Logstash的的連結,以方便大家根據需要詳細瞭解。
Logstash簡介
## 1 Logstash工作原理
### 1.1 處理過程
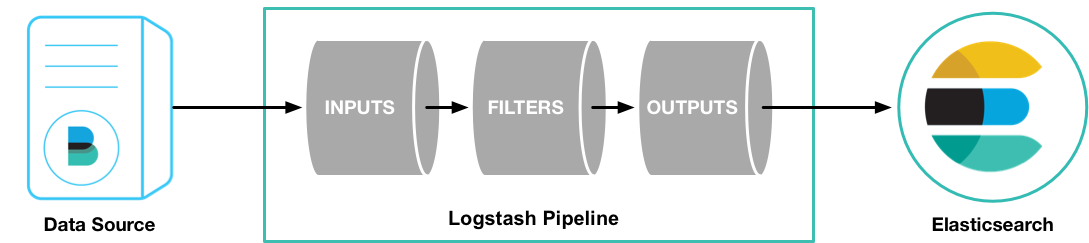Logstash處理過程
如上圖,Logstash的資料處理過程主要包括:**Inputs**, **Filters**, **Outputs** 三部分, 另外在Inputs和Outputs中可以使用**Codecs**對資料格式進行處理。這四個部分均以外掛形式存在,使用者通過定義pipeline配置檔案,設定需要使用的input,filter,output, codec外掛,以實現特定的資料採集,資料處理,資料輸出等功能
- (1)**Inputs**:用於從資料來源獲取資料,常見的外掛如file, syslog, redis, beats 等[[詳細參考](https://www.elastic.co/guide/en/logstash/5.6/input-plugins.html)]
- (2)**Filters**:用於處理資料如格式轉換,資料派生等,常見的外掛如grok, mutate, drop, clone, geoip等[[詳細參考](https://www.elastic.co/guide/en/logstash/5.6/output-plugins.html)]
- (3)**Outputs**:用於資料輸出,常見的外掛如elastcisearch,file, graphite, statsd等[[詳細參考](https://www.elastic.co/guide/en/logstash/5.6/filter-plugins.html)]
- (4)**Codecs**:Codecs不是一個單獨的流程,而是在輸入和輸出等外掛中用於資料轉換的模組,用於對資料進行編碼處理,常見的外掛如json,multiline[[詳細參考](https://www.elastic.co/guide/en/logstash/5.6/codec-plugins.html)]
可以點選每個模組後面的*詳細參考*連結瞭解該模組的外掛列表及對應功能
### 1.2 執行模型:
- (1)每個Input啟動一個執行緒,從對應資料來源獲取資料
- (2)Input會將資料寫入一個佇列:預設為記憶體中的有界佇列(意外停止會導致資料丟失)。為了防止數丟失Logstash提供了兩個特性: [Persistent Queues](https://www.elastic.co/guide/en/logstash/current/persistent-queues.html):通過磁碟上的queue來防止資料丟失 [Dead Letter Queues](https://www.elastic.co/guide/en/logstash/current/dead-letter-queues.html):儲存無法處理的event(僅支援Elasticsearch作為輸出源)
- (3)Logstash會有多個pipeline worker, 每一個pipeline worker會從佇列中取一批資料,然後執行filter和output(worker數目及每次處理的資料量均由配置確定)
## 2 Logstash使用示例
### 2.1 Logstash Hello world
第一個示例Logstash將採用標準輸入和標準輸出作為input和output,並且不指定filter
- (1)下載Logstash並解壓(需要預先安裝JDK8)
- (2)cd到Logstash的根目錄,並執行啟動命令如下:
```js
cd logstash-6.4.0
bin/logstash -e 'input { stdin { } } output { stdout {} }'
```
- (3)此時Logstash已經啟動成功,-e表示在啟動時直接指定pipeline配置,當然也可以將該配置寫入一個配置檔案中,然後通過指定配置檔案來啟動
- (4)在控制檯輸入:hello world,可以看到如下輸出:
```js
{
"@version" => "1",
"host" => "localhost",
"@timestamp" => 2018-09-18T12:39:38.514Z,
"message" => "hello world"
}
```
Logstash會自動為資料新增@version, host, @timestamp等欄位
在這個示例中Logstash從標準輸入中獲得資料,僅在資料中新增一些簡單欄位後將其輸出到標準輸出。
### 2.2 日誌採集
這個示例將採用Filebeat input外掛(Elastic Stack中的輕量級資料採集程式)採集本地日誌,然後將結果輸出到標準輸出
- (1)下載示例使用的日誌檔案[[地址](https://download.elastic.co/demos/logstash/gettingstarted/logstash-tutorial.log.gz)],解壓並將日誌放在一個確定位置
- (2)安裝filebeat,配置並啟動[[參考](https://www.elastic.co/guide/en/beats/filebeat/current/filebeat-getting-started.html)]
filebeat.yml配置如下(paths改為日誌實際位置,不同版本beats配置可能略有變化,請根據情況調整)
```js
filebeat.prospectors:
- input\_type: log
paths:
- /path/to/file/logstash-tutorial.log
output.logstash:
hosts: "localhost:5044"
```
啟動命令:
```js
./filebeat -e -c filebeat.yml -d "publish"
```
- (3)配置logstash並啟動
1)建立first-pipeline.conf檔案內容如下(該檔案為pipeline配置檔案,用於指定input,filter, output等):
```js
input {
beats {
port => "5044"
}
}
#filter {
#}
output {
stdout { codec => rubydebug }
}
```
codec => rubydebug用於美化輸出[[參考](https://www.elastic.co/guide/en/logstash/6.4/plugins-codecs-rubydebug.html)]
2)驗證配置(注意指定配置檔案的路徑):
```js
./bin/logstash -f first-pipeline.conf --config.test_and_exit
```
3)啟動命令:
```js
./bin/logstash -f first-pipeline.conf --config.reload.automatic
```
--config.reload.automatic選項啟用動態過載配置功能
4)預期結果:
可以在Logstash的終端顯示中看到,日誌檔案被讀取並處理為如下格式的多條資料
```js
{
"@timestamp" => 2018-10-09T12:22:39.742Z,
"offset" => 24464,
"@version" => "1",
"input_type" => "log",
"beat" => {
"name" => "VM_136_9_centos",
"hostname" => "VM_136_9_centos",
"version" => "5.6.10"
},
"host" => "VM_136_9_centos",
"source" => "/data/home/michelmu/workspace/logstash-tutorial.log",
"message" => "86.1.76.62 - - [04/Jan/2015:05:30:37 +0000] \"GET /style2.css HTTP/1.1\" 200 4877 \"http://www.semicomplete.com/projects/xdotool/\" \"Mozilla/5.0 (X11; Linux x86_64; rv:24.0) Gecko/20140205 Firefox/24.0 Iceweasel/24.3.0\"",
"type" => "log",
"tags" => [
[0] "beats_input_codec_plain_applied"
]
}
```
相對於示例2.1,該示例使用了filebeat input外掛從日誌中獲取一行記錄,這也是Elastic stack獲取日誌資料最常見的一種方式。另外該示例還採用了rubydebug codec 對輸出的資料進行顯示美化。
### 2.3 日誌格式處理
可以看到雖然示例2.2使用filebeat從日誌中讀取資料,並將資料輸出到標準輸出,但是日誌內容作為一個整體被存放在message欄位中,這樣對後續儲存及查詢都極為不便。可以為該pipeline指定一個[grok filter](https://www.elastic.co/guide/en/logstash/6.4/plugins-filters-grok.html)來對日誌格式進行處理
- (1)在first-pipeline.conf中增加filter配置如下
```js
input {
beats {
port => "5044"
}
}
filter {
grok {
match => { "message" => "%{COMBINEDAPACHELOG}"}
}
}
output {
stdout { codec => rubydebug }
}
```
- (2)到filebeat的根目錄下刪除之前上報的資料歷史(以便重新上報資料),並重啟filebeat
```js
sudo rm data/registry
sudo ./filebeat -e -c filebeat.yml -d "publish"
```
- (3)由於之前啟動Logstash設定了自動更新配置,因此Logstash不需要重新啟動,這個時候可以獲取到的日誌資料如下:
```js
{
"request" => "/style2.css",
"agent" => "\"Mozilla/5.0 (X11; Linux x86_64; rv:24.0) Gecko/20140205 Firefox/24.0 Iceweasel/24.3.0\"",
"offset" => 24464,
"auth" => "-",
"ident" => "-",
"input_type" => "log",
"verb" => "GET",
"source" => "/data/home/michelmu/workspace/logstash-tutorial.log",
"message" => "86.1.76.62 - - [04/Jan/2015:05:30:37 +0000] \"GET /style2.css HTTP/1.1\" 200 4877 \"http://www.semicomplete.com/projects/xdotool/\" \"Mozilla/5.0 (X11; Linux x86_64; rv:24.0) Gecko/20140205 Firefox/24.0 Iceweasel/24.3.0\"",
"type" => "log",
"tags" => [
[0] "beats_input_codec_plain_applied"
],
"referrer" => "\"http://www.semicomplete.com/projects/xdotool/\"",
"@timestamp" => 2018-10-09T12:24:21.276Z,
"response" => "200",
"bytes" => "4877",
"clientip" => "86.1.76.62",
"@version" => "1",
"beat" => {
"name" => "VM_136_9_centos",
"hostname" => "VM_136_9_centos",
"version" => "5.6.10"
},
"host" => "VM_136_9_centos",
"httpversion" => "1.1",
"timestamp" => "04/Jan/2015:05:30:37 +0000"
}
```
可以看到message中的資料被詳細解析出來了
### 2.4 資料派生和增強
Logstash中的一些filter可以根據現有資料生成一些新的資料,如[geoip](https://www.elastic.co/guide/en/logstash/6.4/plugins-filters-geoip.html)可以根據ip生成經緯度資訊
- (1)在first-pipeline.conf中增加geoip配置如下
```js
input {
beats {
port => "5044"
}
}
filter {
grok {
match => { "message" => "%{COMBINEDAPACHELOG}"}
}
geoip {
source => "clientip"
}
}
output {
stdout { codec => rubydebug }
}
```
- (2)如2.3一樣清空filebeat歷史資料,並重啟
- (3)當然Logstash仍然不需要重啟,可以看到輸出變為如下:
```js
{
"request" => "/style2.css",
"agent" => "\"Mozilla/5.0 (X11; Linux x86_64; rv:24.0) Gecko/20140205 Firefox/24.0 Iceweasel/24.3.0\"",
"geoip" => {
"timezone" => "Europe/London",
"ip" => "86.1.76.62",
"latitude" => 51.5333,
"continent_code" => "EU",
"city_name" => "Willesden",
"country_name" => "United Kingdom",
"country_code2" => "GB",
"country_code3" => "GB",
"region_name" => "Brent",
"location" => {
"lon" => -0.2333,
"lat" => 51.5333
},
"postal_code" => "NW10",
"region_code" => "BEN",
"longitude" => -0.2333
},
"offset" => 24464,
"auth" => "-",
"ident" => "-",
"input_type" => "log",
"verb" => "GET",
"source" => "/data/home/michelmu/workspace/logstash-tutorial.log",
"message" => "86.1.76.62 - - [04/Jan/2015:05:30:37 +0000] \"GET /style2.css HTTP/1.1\" 200 4877 \"http://www.semicomplete.com/projects/xdotool/\" \"Mozilla/5.0 (X11; Linux x86_64; rv:24.0) Gecko/20140205 Firefox/24.0 Iceweasel/24.3.0\"",
"type" => "log",
"tags" => [
[0] "beats_input_codec_plain_applied"
],
"referrer" => "\"http://www.semicomplete.com/projects/xdotool/\"",
"@timestamp" => 2018-10-09T12:37:46.686Z,
"response" => "200",
"bytes" => "4877",
"clientip" => "86.1.76.62",
"@version" => "1",
"beat" => {
"name" => "VM_136_9_centos",
"hostname" => "VM_136_9_centos",
"version" => "5.6.10"
},
"host" => "VM_136_9_centos",
"httpversion" => "1.1",
"timestamp" => "04/Jan/2015:05:30:37 +0000"
}
```
可以看到根據ip派生出了許多地理位置資訊資料
### 2.5 將資料匯入Elasticsearch
Logstash作為Elastic stack的重要組成部分,其最常用的功能是將資料匯入到Elasticssearch中。將Logstash中的資料匯入到Elasticsearch中操作也非常的方便,只需要在pipeline配置檔案中增加Elasticsearch的output即可。
- (1)首先要有一個已經部署好的Logstash,當然可以使用騰訊雲快速建立一個Elasticsearch[建立地址](https://console.cloud.tencent.com/es)
- (2)在first-pipeline.conf中增加Elasticsearch的配置,如下
```js
input {
beats {
port => "5044"
}
}
filter {
grok {
match => { "message" => "%{COMBINEDAPACHELOG}"}
}
geoip {
source => "clientip"
}
}
output {
elasticsearch {
hosts => [ "localhost:9200" ]
}
}
```
- (3)清理filebeat歷史資料,並重啟
- (4)查詢Elasticsearch確認資料是否正常上傳(注意替換查詢語句中的日期)
```js
curl -XGET 'http://172.16.16.17:9200/logstash-2018.10.09/_search?pretty&q=response=200'
```
- (5)如果Elasticsearch關聯了Kibana也可以使用kibana檢視資料是否正常上報
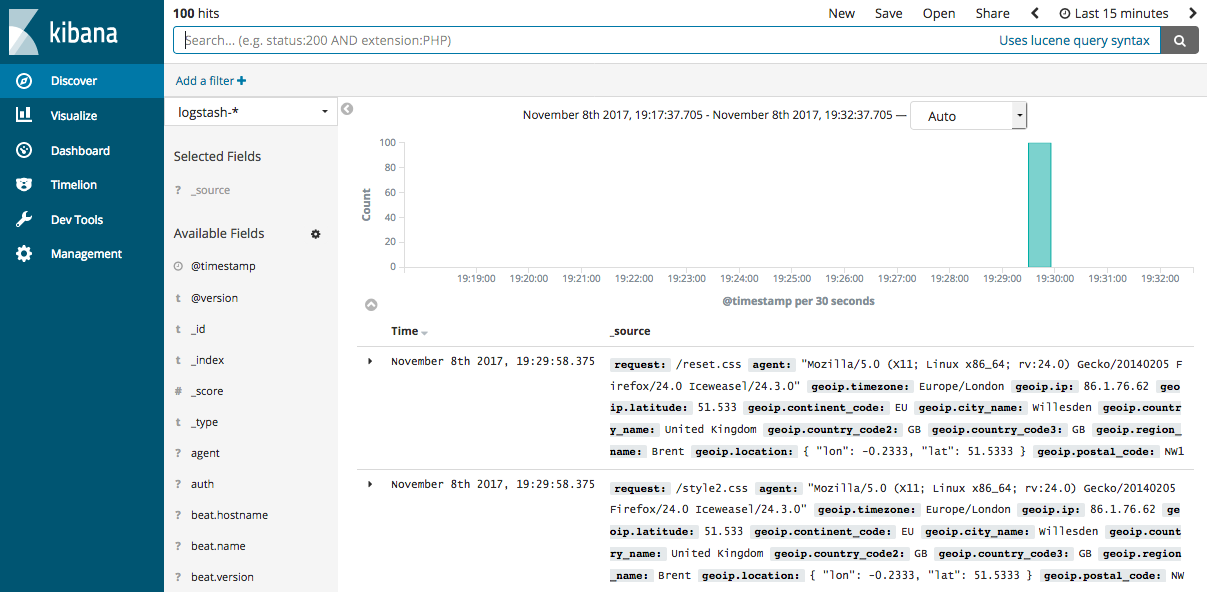kibana圖示
Logstash提供了大量的Input, filter, output, codec的外掛,使用者可以根據自己的需要,使用一個或多個元件實現自己的功能,當然使用者也可以自定義外掛以實現更為定製化的功能。自定義外掛可以參考[[logstash input外掛開發](https://cloud.tencent.com/developer/article/1171033)]
## 3 部署Logstash
演示過如何快速使用Logstash後,現在詳細講述一下Logstash的部署方式。
### 3.1 安裝
- **安裝JDK**:Logstash採用JRuby編寫,執行需要JDK環境,因此安裝Logstash前需要先安裝JDK。(當前6.4僅支援JDK8)
- **安裝Logstash**:可以採用直接下載壓縮包方式安裝,也通過APT或YUM安裝,另外Logstash支援安裝到Docker中。[[Logstash安裝參考](https://www.elastic.co/guide/en/logstash/current/installing-logstash.html)]
- **安裝X-PACK**:在6.3及之後版本X-PACK會隨Logstash安裝,在此之前需要手動安裝[[參考連結](https://www.elastic.co/guide/en/logstash/6.2/installing-xpack-log.html)]
### 3.2 目錄結構
logstash的目錄主要包括:**根目錄**、**bin目錄**、**配置目錄**、**日誌目錄**、**外掛目錄**、**資料目錄**
不同安裝方式各目錄的預設位置參考[[此處](https://www.elastic.co/guide/en/logstash/current/dir-layout.html)]
### 3.3 配置檔案
- Pipeline配置檔案,名稱可以自定義,在啟動Logstash時顯式指定,編寫方式可以參考前面示例,對於具體外掛的配置方式參見具體外掛的說明(使用Logstash時必須配置): 用於定義一個pipeline,資料處理方式和輸出源
- Settings配置檔案(可以使用預設配置): 在使用Logstash時可以不用設定,用於效能調優,日誌記錄等 - logstash.yml:用於控制logstash的執行過程[[參考連結](https://www.elastic.co/guide/en/logstash/current/logstash-settings-file.html)] - pipelines.yml: 如果有多個pipeline時使用該配置來配置多pipeline執行[[參考連結](https://www.elastic.co/guide/en/logstash/current/multiple-pipelines.html)] - jvm.options:jvm的配置 - log4j2.properties:log4j 2的配置,用於記錄logstash執行日誌[[參考連結](https://www.elastic.co/guide/en/logstash/current/logging.html#log4j2)] - startup.options: 僅適用於Lniux系統,用於設定系統啟動專案!
- 為了保證敏感配置的安全性,logstash提供了配置加密功能[[參考連結](https://www.elastic.co/guide/en/logstash/current/keystore.html)]
### 3.4 啟動關閉方式
#### 3.4.1 啟動
- [命令列啟動](https://www.elastic.co/guide/en/logstash/current/running-logstash-command-line.html)
- [在debian和rpm上以服務形式啟動](https://www.elastic.co/guide/en/logstash/current/running-logstash.html)
- [在docker中啟動](https://www.elastic.co/guide/en/logstash/current/docker.html)3.4.2 關閉
- [關閉Logstash](https://www.elastic.co/guide/en/logstash/current/shutdown.html)
- Logstash的關閉時會先關閉input停止輸入,然後處理完所有進行中的事件,然後才完全停止,以防止資料丟失,但這也導致停止過程出現延遲或失敗的情況。
### 3.5 擴充套件Logstash
當單個Logstash無法滿足效能需求時,可以採用橫向擴充套件的方式來提高Logstash的處理能力。橫向擴充套件的多個Logstash相互獨立,採用相同的pipeline配置,另外可以在這多個Logstash前增加一個LoadBalance,以實現多個Logstash的負載均衡。
## 4 效能調優
[[詳細調優參考](https://www.elastic.co/guide/en/logstash/current/performance-tuning.html)]
- (1)**Inputs和Outputs的效能**:當輸入輸出源的效能已經達到上限,那麼效能瓶頸不在Logstash,應優先對輸入輸出源的效能進行調優。
- (2)
系統性能指標
:
- **CPU**:確定CPU使用率是否過高,如果CPU過高則先檢視JVM堆空間使用率部分,確認是否為GC頻繁導致,如果GC正常,則可以通過調節Logstash worker相關配置來解決。
- **記憶體**:由於Logstash執行在JVM上,因此注意調整JVM堆空間上限,以便其有足夠的執行空間。另外注意Logstash所在機器上是否有其他應用佔用了大量記憶體,導致Logstash記憶體磁碟交換頻繁。
- **I/O使用率**: 1)*磁碟IO*: 磁碟IO飽和可能是因為使用了會導致磁碟IO飽和的建立(如file output),另外Logstash中出現錯誤產生大量錯誤日誌時也會導致磁碟IO飽和。Linux下可以通過iostat, dstat等檢視磁碟IO情況 2)*網路IO*: 網路IO飽和一般發生在使用有大量網路操作的外掛時。linux下可以使用dstat或iftop等檢視網路IO情況
- (3)
JVM堆檢查
:
- 如果JVM堆大小設定過小會導致GC頻繁,從而導致CPU使用率過高
- 快速驗證這個問題的方法是double堆大小,看效能是否有提升。注意要給系統至少預留1GB的空間。
- 為了精確查詢問題可以使用jmap或VisualVM。[[參考](https://www.elastic.co/guide/en/logstash/current/tuning-logstash.html#profiling-the-heap)]
- 設定Xms和Xmx為相同值,防止堆大小在執行時調整,這個過程非常消耗效能。
- (4)**Logstash worker設定**: worker相關配置在logstash.yml中,主要包括如下三個: - *pipeline.workers*: 該引數用以指定Logstash中執行filter和output的執行緒數,當如果發現CPU使用率尚未達到上限,可以通過調整該引數,為Logstash提供更高的效能。建議將Worker數設定適當超過CPU核數可以減少IO等待時間對處理過程的影響。實際調優中可以先通過-w指定該引數,當確定好數值後再寫入配置檔案中。 - *pipeline.batch.size*: 該指標用於指定單個worker執行緒一次性執行flilter和output的event批量數。增大該值可以減少IO次數,提高處理速度,但是也以為這增加記憶體等資源的消耗。當與Elasticsearch聯用時,該值可以用於指定Elasticsearch一次bluck操作的大小。 - *pipeline.batch.delay*: 該指標用於指定worker等待時間的超時時間,如果worker在該時間內沒有等到pipeline.batch.size個事件,那麼將直接開始執行filter和output而不再等待。
### 結束語
Logstash作為Elastic Stack的重要組成部分,在Elasticsearch資料採集和處理過程中扮演著重要的角色。本文通過簡單示例的演示和Logstash基礎知識的鋪陳,希望可以幫助初次接觸Logstash的使用者對Logstash有一個整體認識,並能較為快速上手。對於Logstash的高階使用,仍需要使用者在使用過程中結合實際情況查閱相關資源深入研究。當然也歡迎大家積極交流,並對文中的錯誤提出寶貴意見。
### MORE:
- [Logstash資料處理常見示例](https://www.elastic.co/guide/en/logstash/current/transformation.html)
- [Logstash日誌相關配置參考](https://www.elastic.co/guide/en/logstash/current/logging.html)
- [Kibana管理Logstash pipeline配置](https://www.elastic.co/guide/en/logstash/current/logstash-centralized-pipeline-management.html)
- [LogstashModule](https://www.elastic.co/guide/en/logstash/current/logstash-modules.html)
- [監控Logstash](https://www.elastic.co/guide/en/logstash/current/monitoring-logstash.html)
> **相關閱讀**
> [大資料基礎系列之spark的監控體系介紹](https://cloud.tencent.com/developer/article/1032518?fromSource=waitui)
> [Neutron lbaas代理https實踐](https://cloud.tencent.com/developer/article/1047847?fromSource=waitui)
> [【每日課程推薦】機器學習實戰!快速入門線上廣告業務及CTR相應知識](https://cloud.tencent.com/developer/edu/course-1128?fromSource=waitui)
**此文已由作者授權騰訊雲+社群釋出,更多原文請[點選](https://cloud.tencent.com/developer/article/1353068?fromSource=waitui )**
**搜尋關注公眾號「雲加社群」,第一時間獲取技術乾貨,關注後回覆1024 送你一份技術課程大禮包!**
海量技術實踐經驗,盡在[雲加社群](https://cloud.tencent.com/developer?fromSource=waitui)!