
Android之餅圖
阿新 • • 發佈:2018-12-12
第一步匯入library
詳細見MPchart使用詳解及詳細屬性(一)
- 1
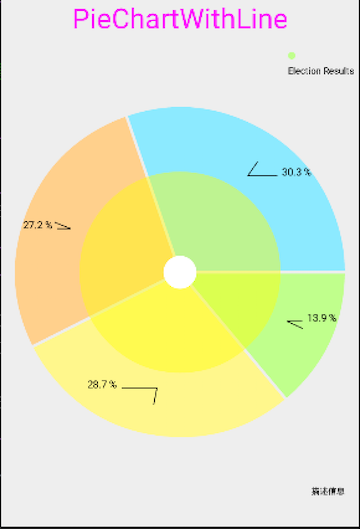
第二步pieChart原始碼
import android.app.Activity;
import android.graphics.Color;
import android.graphics.Typeface;
import android.os.Bundle;
import android.text.SpannableString;
import android.text.style.ForegroundColorSpan;
import android.text.style.RelativeSizeSpan;
import android.text.style.StyleSpan;

import com.github.mikephil.charting.animation.Easing;
import com.github.mikephil.charting.charts.PieChart;
import com.github.mikephil.charting.components.Legend;
import com.github.mikephil.charting.data.Entry;
import com.github.mikephil.charting.data.PieData;
import com.github.mikephil.charting.data.PieDataSet;
import com.github.mikephil.charting.formatter.PercentFormatter;
import com.github.mikephil.charting.highlight.Highlight;
import com.github.mikephil.charting.listener.OnChartValueSelectedListener;
import com.github.mikephil.charting.utils.ColorTemplate;

import java.util.ArrayList;

public class PieChartWithline extends Activity implements OnChartValueSelectedListener {
    private PieChart pie_chart_with_line;

    private Typeface tf;

    protected String[] mParties = new String[] {
            "Party A", "Party B", "Party C", "Party D", "Party E", "Party F", "Party G", "Party H",
            "Party I", "Party J", "Party K", "Party L", "Party M", "Party N", "Party O", "Party P",
            "Party Q", "Party R", "Party S", "Party T", "Party U", "Party V", "Party W", "Party X",
            "Party Y", "Party Z"
    };

    @Override
    protected void onCreate(Bundle savedInstanceState) {
        super.onCreate(savedInstanceState);
        setContentView(R.layout.activity_pie_chart_withline);

        pie_chart_with_line = (PieChart) findViewById(R.id.pie_chart_with_line);

        /**
         * 是否使用百分比
         */
        pie_chart_with_line.setUsePercentValues(true);
        /**
         * 描述資訊
         */
        pie_chart_with_line.setDescription("描述資訊");

//        tf = Typeface.createFromAsset(getAssets(), "OpenSans-Regular.ttf");

//        pie_chart_with_line.setCenterTextTypeface(Typeface.createFromAsset(getAssets(), "OpenSans-Light.ttf"));
        /**
         * 設定圓環中間的文字
         */
        pie_chart_with_line.setCenterText(generateCenterSpannableText());

        /**
         * 圓環距離螢幕上下上下左右的距離
         */
        pie_chart_with_line.setExtraOffsets(5f, 5.f, 5.f, 5.f);

        /**
         * 是否顯示圓環中間的洞
         */
        pie_chart_with_line.setDrawHoleEnabled(true);
        /**
         * 設定中間洞的顏色
         */
        pie_chart_with_line.setHoleColor(Color.WHITE);

        /**
         * 設定圓環透明度及半徑
         */
        pie_chart_with_line.setTransparentCircleColor(Color.YELLOW);
        pie_chart_with_line.setTransparentCircleAlpha(110);
        pie_chart_with_line.setTransparentCircleRadius(61f);

        /**
         * 設定圓環中間洞的半徑
         */
        pie_chart_with_line.setHoleRadius(60f);

        /**
         * 是否顯示洞中間文字
         */
        pie_chart_with_line.setDrawCenterText(true);

        /**
         *觸控是否可以旋轉以及鬆手後旋轉的度數
         */
        pie_chart_with_line.setRotationAngle(20);
        // enable rotation of the chart by touch
        pie_chart_with_line.setRotationEnabled(true);

        // pie_chart_with_line.setUnit(" €");
        // pie_chart_with_line.setDrawUnitsInChart(true);

        /**
         *add a selection listener 值改變時候的監聽
         */
        pie_chart_with_line.setOnChartValueSelectedListener(this);

        setData(3, 100);

        Legend l = pie_chart_with_line.getLegend();
        l.setPosition(Legend.LegendPosition.RIGHT_OF_CHART_INSIDE);
        l.setEnabled(true);
        l.setDirection(Legend.LegendDirection.LEFT_TO_RIGHT);
        l.setForm(Legend.LegendForm.CIRCLE);

        l.setFormSize(8f);
        l.setFormToTextSpace(4f);
        l.setXEntrySpace(6f);

        pie_chart_with_line.animateY(1400, Easing.EasingOption.EaseInOutQuad);


    }

    private SpannableString generateCenterSpannableText() {

        SpannableString s = new SpannableString("MPAndroidChart\ndeveloped by Philipp Jahoda");
        s.setSpan(new RelativeSizeSpan(1.7f), 0, 14, 0);
        s.setSpan(new StyleSpan(Typeface.NORMAL), 14, s.length() - 15, 0);
        s.setSpan(new ForegroundColorSpan(Color.GRAY), 14, s.length() - 15, 0);
        s.setSpan(new RelativeSizeSpan(.8f), 14, s.length() - 15, 0);
        s.setSpan(new StyleSpan(Typeface.ITALIC), s.length() - 14, s.length(), 0);
        s.setSpan(new ForegroundColorSpan(ColorTemplate.getHoloBlue()), s.length() - 14, s.length(), 0);
        return s;
    }

    private void setData(int count, float range) {

        float mult = range;

        ArrayList<Entry> yVals1 = new ArrayList<Entry>();

        // IMPORTANT: In a PieChart, no values (Entry) should have the same
        // xIndex (even if from different DataSets), since no values can be
        // drawn above each other.
        for (int i = 0; i < count + 1; i++) {
            yVals1.add(new Entry((float) (Math.random() * mult) + mult / 5, i));
        }

        ArrayList<String> xVals = new ArrayList<String>();

        for (int i = 0; i < count + 1; i++)
            xVals.add(mParties[i % mParties.length]);

        PieDataSet dataSet = new PieDataSet(yVals1, "Election Results");
        dataSet.setSliceSpace(3f);
        dataSet.setSelectionShift(5f);
        dataSet.setXValuePosition(PieDataSet.ValuePosition.OUTSIDE_SLICE);

        // add a lot of colors

        ArrayList<Integer> colors = new ArrayList<Integer>();

        for (int c : ColorTemplate.VORDIPLOM_COLORS)
            colors.add(c);

        for (int c : ColorTemplate.JOYFUL_COLORS)
            colors.add(c);

        for (int c : ColorTemplate.COLORFUL_COLORS)
            colors.add(c);

        for (int c : ColorTemplate.LIBERTY_COLORS)
            colors.add(c);

        for (int c : ColorTemplate.PASTEL_COLORS)
            colors.add(c);

        colors.add(ColorTemplate.getHoloBlue());

        dataSet.setColors(colors);
        //dataSet.setSelectionShift(0f);


        dataSet.setValueLinePart1OffsetPercentage(80.f);
        dataSet.setValueLinePart1Length(0.3f);
        dataSet.setValueLinePart2Length(0.4f);
        // dataSet.setXValuePosition(PieDataSet.ValuePosition.OUTSIDE_SLICE);
        dataSet.setYValuePosition(PieDataSet.ValuePosition.OUTSIDE_SLICE);

        PieData data = new PieData(xVals, dataSet);
        data.setValueFormatter(new PercentFormatter());
        data.setValueTextSize(11f);
        data.setValueTextColor(Color.BLACK);
        data.setValueTypeface(tf);
        //設定X顯示的內容 這裡為了滿足UI 設定空
        ArrayList<String > a = new ArrayList<>();
        a.add("");

        data.setXVals(a);
        pie_chart_with_line.setData(data);


        // undo all highlights
        pie_chart_with_line.highlightValues(null);

        pie_chart_with_line.invalidate();
    }

    @Override
    public void onValueSelected(Entry e, int dataSetIndex, Highlight h) {

    }

    @Override
    public void onNothingSelected() {

    }
}
第三步詳細屬性描述
圓環距離螢幕上下上下左右的距離
pie_chart_with_line.setExtraOffsets(80f, 5.f, 5.f, 5.f);- 1
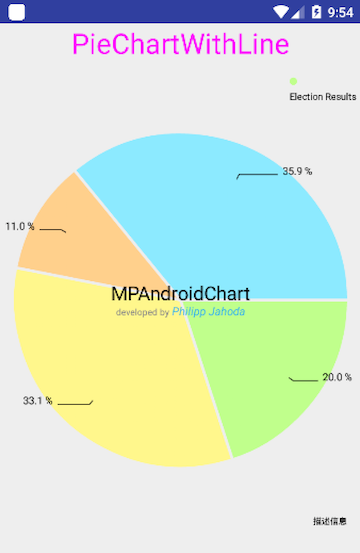
是否顯示圓環中間的洞
pie_chart_with_line.setDrawHoleEnabled(false);- 1
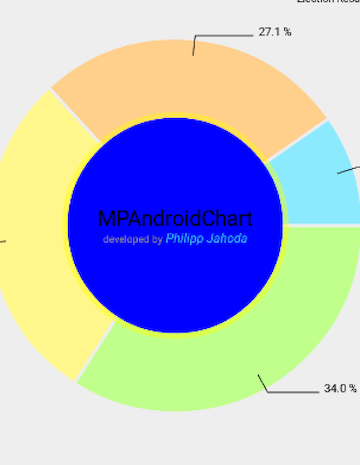
設定中間洞的顏色
pie_chart_with_line.setHoleColor(Color.WHITE);- 1
設定圓環透明度及半徑
pie_chart_with_line.setTransparentCircleColor(Color.YELLOW);
        pie_chart_with_line.setTransparentCircleAlpha(110);
        pie_chart_with_line.setTransparentCircleRadius(61f);
- 1
- 2
- 3
是否顯示洞中間文字
pie_chart_with_line.setDrawCenterText(false);- 1
觸控是否可以旋轉以及鬆手後旋轉的度數
pie_chart_with_line.setRotationAngle(20);
// enable rotation of the chart by touch
pie_chart_with_line.setRotationEnabled(true);
add a selection listener 值改變時候的監聽
pie_chart_with_line.setOnChartValueSelectedListener(this);
設定圖表
Legend l = pie_chart_with_line.getLegend();
        l.setPosition(Legend.LegendPosition.RIGHT_OF_CHART_INSIDE);
        l.setEnabled(true);
        l.setDirection(Legend.LegendDirection.LEFT_TO_RIGHT);
        l.setForm(Legend.LegendForm.CIRCLE);

        l.setFormSize(8f);
        l.setFormToTextSpace(4f);
        l.setXEntrySpace(6f);
pieChart.invalidate();//重新整理圖表