
ElasticSearch 簡介與外掛安裝(logstash、kibana)
文章目錄
簡介
ElasticSearch是一個基於Lucene的搜尋伺服器。它提供了一個分散式多使用者能力的全文搜尋引擎,基於RESTful web介面。Elasticsearch是用Java開發的,並作為Apache許可條款下的開放原始碼釋出,是當前流行的企業級搜尋引擎。設計用於雲端計算中,能夠達到實時搜尋,穩定,可靠,快速,安裝使用方便。
我們建立一個網站或應用程式,並要新增搜尋功能,但是想要完成搜尋工作的建立是非常困難的。我們希望搜尋解決方案要執行速度快,我們希望能有一個零配置和一個完全免費的搜尋模式,我們希望能夠簡單地使用JSON通過HTTP來索引資料,我們希望我們的搜尋伺服器始終可用,我們希望能夠從一臺開始並擴充套件到數百臺,我們要實時搜尋,我們要簡單的多租戶,我們希望建立一個雲的解決方案。因此我們利用Elasticsearch來解決所有這些問題及可能出現的更多其它問題。
安裝
elasticsearch安裝
- 下載安裝包 下載地址
- 解壓 執行bin 目錄中的elasticsearch.bat 或者, 後臺程序啟動 :如elasticsearch.bat -d -p 123。
- 瀏覽器中輸入 http://127.0.0.1:9200/ 會顯示出下面的資訊 證明安裝成功
{
  "name" : "4LQkK5-",
  "cluster_name" : "elasticsearch",
  "cluster_uuid" : "b-M0r96WQOCGwMFUWF0U1Q",
  "version" : {
    "number" : "6.5.0",
    "build_flavor" : "default",
    "build_type" : "zip",
    "build_hash" : "816e6f6",
    "build_date" : "2018-11-09T18:58:36.352602Z",
    "build_snapshot" : false,
    "lucene_version" : "7.5.0",
    "minimum_wire_compatibility_version" : "5.6.0",
    "minimum_index_compatibility_version" : "5.0.0"
  },
  "tagline" : "You Know, for Search"
}
kibana安裝
Kibana是一個為Elasticsearch平臺分析和視覺化的開源平臺,使用Kibana能夠搜尋、展示儲存在Elasticsearch中的索引資料。使用它可以很方便用圖表、表格、地圖展示和分析資料。
Kibana能夠輕鬆處理大量資料,通過瀏覽器介面能夠輕鬆的建立和分享儀表盤,通過改變Elasticsearch查詢時間,可以完成動態儀表盤。
- 下載安裝包 下載地址
- 解壓到某個目錄 例如 D:\kibana-6.5.0-windows-x86_64
- 根據實際情況修改配置檔案 D:\kibana-6.5.0-windows-x86_64\config
- 啟動 D:\kibana-6.5.0-windows-x86_64\bin\kibana.bat
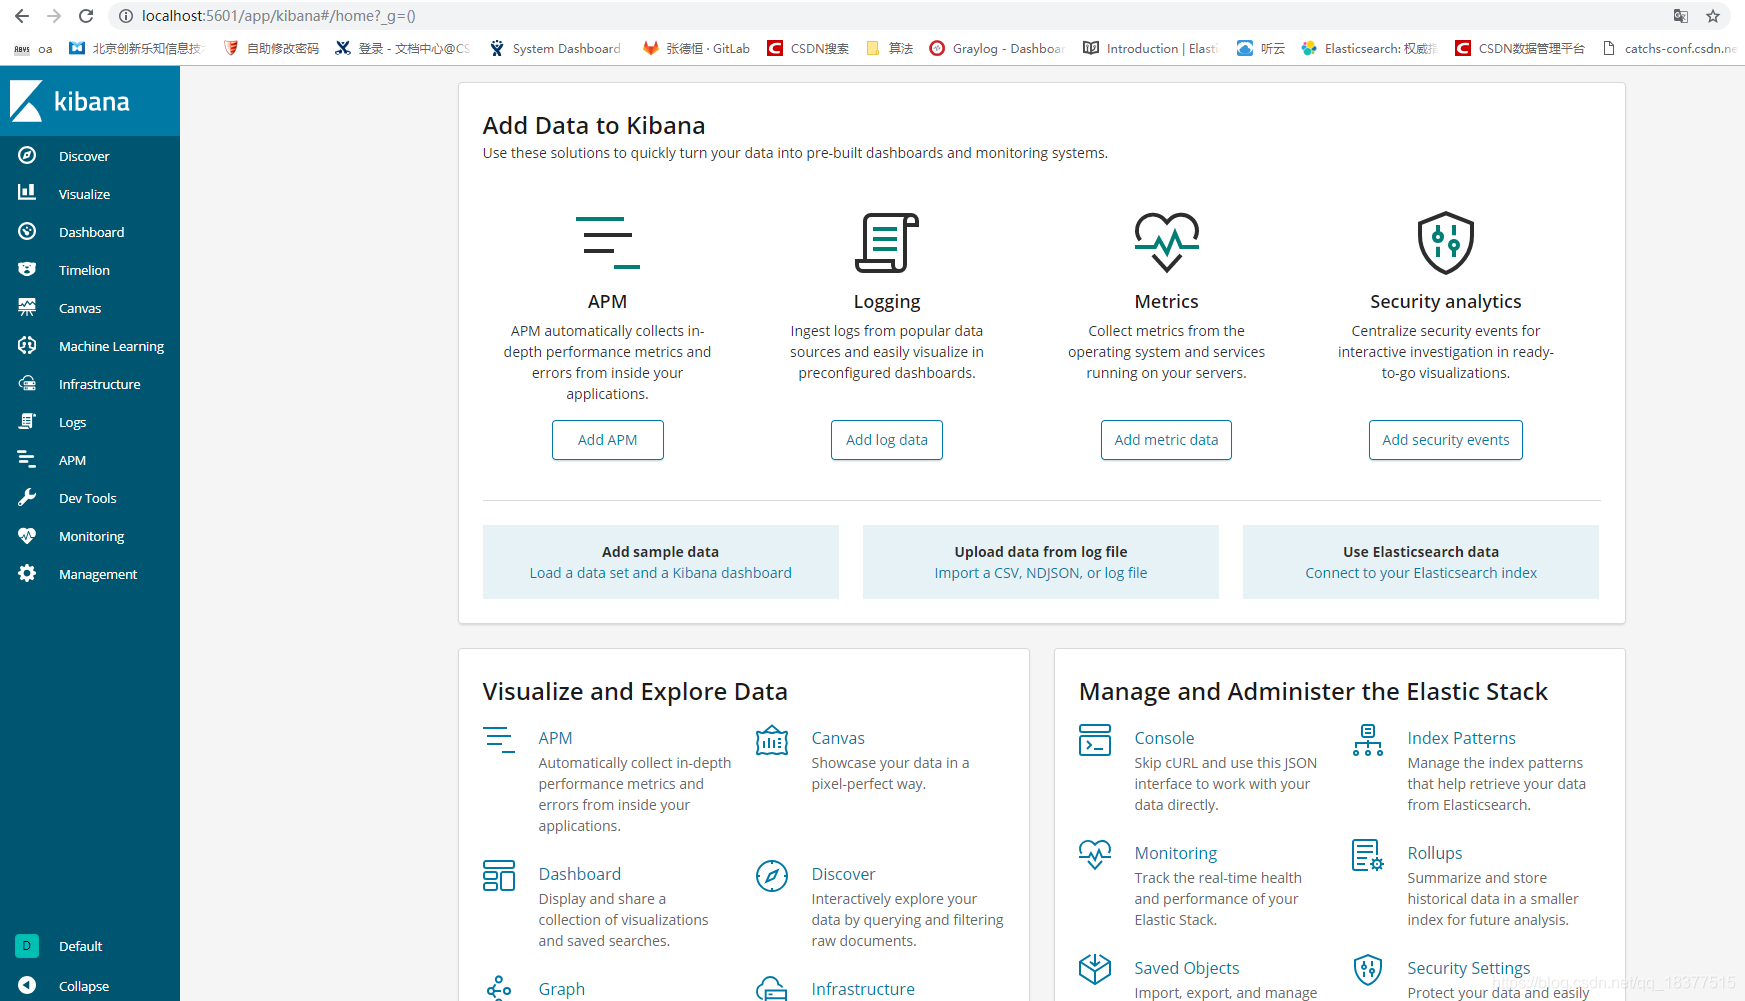
- 訪問 http://localhost:5601/
logstash 安裝
logstash是一個數據分析軟體,主要目的是分析log日誌。整一套軟體可以當作一個MVC模型,logstash是controller層,Elasticsearch是一個model層,kibana是view層。
首先將資料傳給logstash,它將資料進行過濾和格式化(轉成JSON格式),然後傳給Elasticsearch進行儲存、建搜尋的索引,kibana提供前端的頁面再進行搜尋和圖表視覺化,它是呼叫Elasticsearch的介面返回的資料進行視覺化。logstash和Elasticsearch是用Java寫的,kibana使用node.js框架。
logstash windows 安裝
- 解壓下載的目錄 D:\logstash-6.5.0
- 進入bin目錄 執行 logstash -e “input { stdin { } } output { stdout { codec => rubydebug } }”
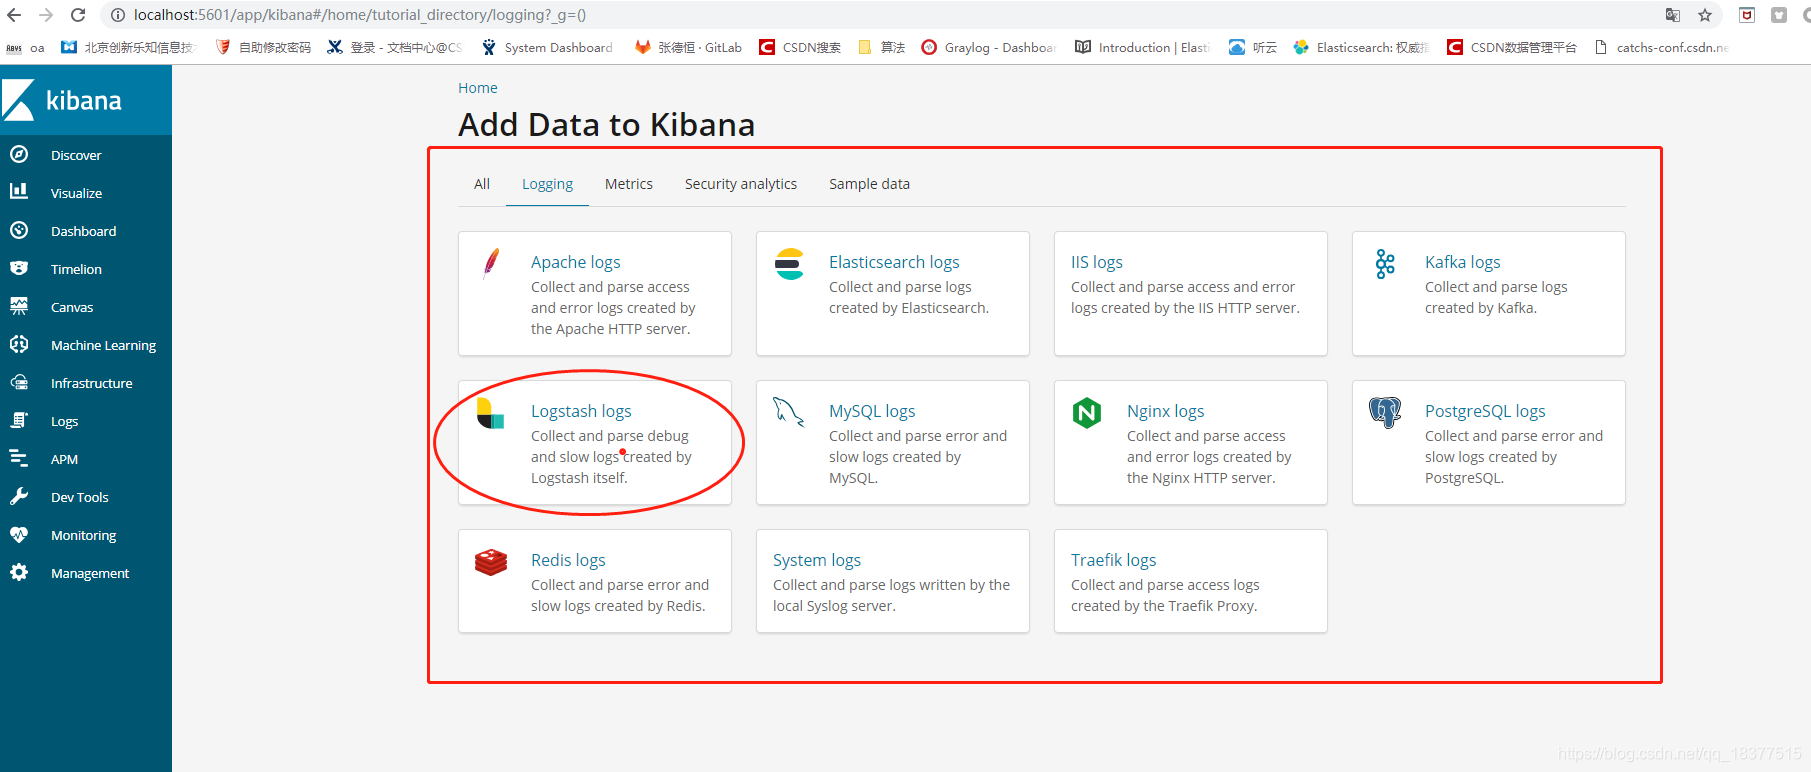
kanaba 中新增logstash
- 下載安裝包 並解壓到 D:\filebeat-6.5.0-windows-x86_64
- 重新命名filebeat-6.5.0-windows 為FileBeat
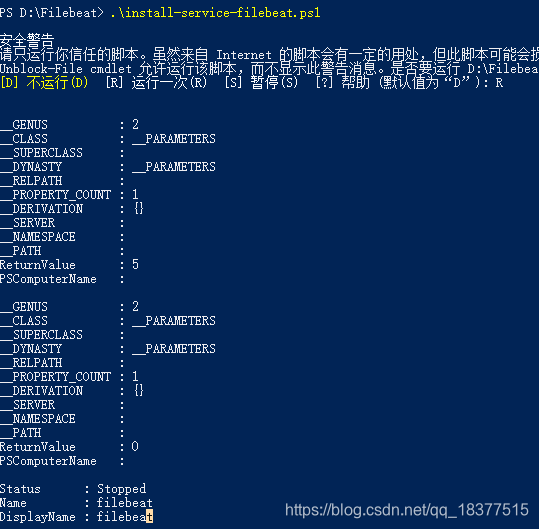
- 管理員執行 PowerShell
- 執行install-service-filebeat.ps1
- 修改D:\Filebeat\filebeat.yml 檔案
#============================== Kibana =====================================

# Starting with Beats version 6.0.0, the dashboards are loaded via the Kibana API.
# This requires a Kibana endpoint configuration.
setup.kibana:

  # Kibana Host
  # Scheme and port can be left out and will be set to the default (http and 5601)
  # In case you specify and additional path, the scheme is required: http://localhost:5601/path
  # IPv6 addresses should always be defined as: https://[2001:db8::1]:5601
  host: "localhost:5601"

  # Kibana Space ID
  # ID of the Kibana Space into which the dashboards should be loaded. By default,
  # the Default Space will be used.
  #space.id:

#============================= Elastic Cloud ==================================

# These settings simplify using filebeat with the Elastic Cloud (https://cloud.elastic.co/).

# The cloud.id setting overwrites the `output.elasticsearch.hosts` and
# `setup.kibana.host` options.
# You can find the `cloud.id` in the Elastic Cloud web UI.
#cloud.id:

# The cloud.auth setting overwrites the `output.elasticsearch.username` and
# `output.elasticsearch.password` settings. The format is `<user>:<pass>`.
#cloud.auth:

#================================ Outputs =====================================

# Configure what output to use when sending the data collected by the beat.

#-------------------------- Elasticsearch output ------------------------------
output.elasticsearch:
  # Array of hosts to connect to.
  hosts: ["localhost:9200"]

  # Optional protocol and basic auth credentials.
  #protocol: "https"
  #username: "elastic"
  #password: "changeme"
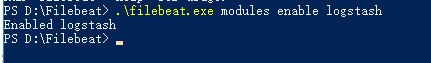
- 啟用和配置 logstash 模組
- Start Filebeat
PS C:\Program Files\Filebeat> filebeat.exe setup
PS C:\Program Files\Filebeat> Start-Service filebeat
參考的文章
https://www.elastic.co/
https://www.elastic.co/guide/en/elasticsearch/reference/index.html
https://www.cnblogs.com/dreamroute/p/8484457.html
https://www.cnblogs.com/yincheng/p/logstash.html