
CentOS壓力測試 ab 命令安裝與使用
1.獨立安裝
ab運行需要依賴apr-util包,安裝命令為:
yum install apr-util
因為在後面的命令中要用到yumdownload,如果沒有找到 yumdownload 命令可以使用以下命令安裝依賴 yum-utils中的yumdownload 工具
yum install yum-utils
2.安裝完成後執行以下指令
cd /opt
mkdir abtmp
cd abtmp
yum install yum-utils.noarch
yumdownloader httpd-tools*
rpm2cpio httpd-*.rpm | cpio -idmv
解開後就能得到獨立的 ab可執行文件了。
操作完成後 將會產生一個 usr 目錄 ab文件就在這個usr 目錄中
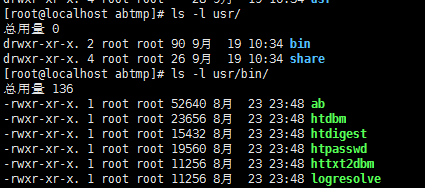
上述命令成功後,可以在abtmp下的usr/bin中看到一個名為ab的文件,復制到系統PATH下就大功告成
簡單使用
1. 最基本的關心兩個選項 -c -n
例: ./ab -c 100 -n 10000 http://127.0.0.1/index.php
-c 100 即:每次並發100個
-n 10000 即: 共發送10000個請求
需了解幾個關於壓力測試的概念
-
吞吐率(Requests per second)
概念:服務器並發處理能力的量化描述,單位是reqs/s,指的是某個並發用戶數下單位時間內處理的請求數。某個並發用戶數下單位時間內能處理的最大請求數,稱之為最大吞吐率。
計算公式:總請求數 / 處理完成這些請求數所花費的時間,即
Request per second = Complete requests / Time taken for tests -
並發連接數(The number of concurrent connections)
概念:某個時刻服務器所接受的請求數目,簡單的講,就是一個會話。 -
並發用戶數(The number of concurrent users,Concurrency Level)
概念:要註意區分這個概念和並發連接數之間的區別,一個用戶可能同時會產生多個會話,也即連接數。 -
用戶平均請求等待時間(Time per request)
計算公式:處理完成所有請求數所花費的時間/ (總請求數 / 並發用戶數),即
Time per request = Time taken for tests /( Complete requests / Concurrency Level) -
服務器平均請求等待時間(Time per request: across all concurrent requests)
計算公式:處理完成所有請求數所花費的時間 / 總請求數,即
Time taken for / testsComplete requests
可以看到,它是吞吐率的倒數。
同時,它也=用戶平均請求等待時間/並發用戶數,即
Time per request / Concurrency Level
Usage: ab [options] [http[s]://]hostname[:port]/path
Options are:
    -n requests     Number of requests to perform   //請求鏈接數
    -c concurrency  Number of multiple requests to make at a time   //表示並發數
    -t timelimit    Seconds to max. to spend on benchmarking
                    This implies -n 50000
    -s timeout      Seconds to max. wait for each response
                    Default is 30 seconds
    -b windowsize   Size of TCP send/receive buffer, in bytes
    -B address      Address to bind to when making outgoing connections
    -p postfile     File containing data to POST. Remember also to set -T
    -u putfile      File containing data to PUT. Remember also to set -T
    -T content-type Content-type header to use for POST/PUT data, eg.
                    ‘application/x-www-form-urlencoded‘
                    Default is ‘text/plain‘
    -v verbosity    How much troubleshooting info to print
    -w              Print out results in HTML tables
    -i              Use HEAD instead of GET
    -x attributes   String to insert as table attributes
    -y attributes   String to insert as tr attributes
    -z attributes   String to insert as td or th attributes
    -C attribute    Add cookie, eg. ‘Apache=1234‘. (repeatable)
    -H attribute    Add Arbitrary header line, eg. ‘Accept-Encoding: gzip‘
                    Inserted after all normal header lines. (repeatable)
    -A attribute    Add Basic WWW Authentication, the attributes
                    are a colon separated username and password.
    -P attribute    Add Basic Proxy Authentication, the attributes
                    are a colon separated username and password.
    -X proxy:port   Proxyserver and port number to use
    -V              Print version number and exit
    -k              Use HTTP KeepAlive feature
    -d              Do not show percentiles served table.
    -S              Do not show confidence estimators and warnings.
    -q              Do not show progress when doing more than 150 requests
    -l              Accept variable document length (use this for dynamic pages)
    -g filename     Output collected data to gnuplot format file.
    -e filename     Output CSV file with percentages served
    -r              Don‘t exit on socket receive errors.
    -h              Display usage information (this message)
    -Z ciphersuite  Specify SSL/TLS cipher suite (See openssl ciphers)
    -f protocol     Specify SSL/TLS protocol
                    (SSL3, TLS1, TLS1.1, TLS1.2 or ALL)
示例詳解
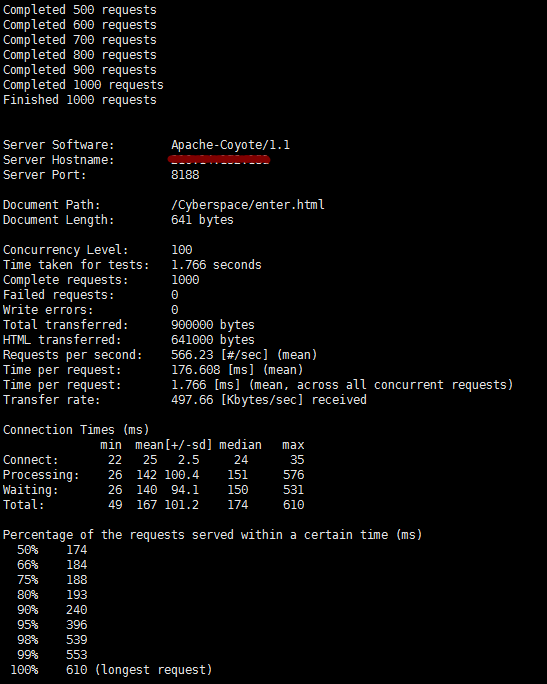
Concurrency Level: 100    //並發請求數

 Time taken for tests: 50.872 seconds  //整個測試持續的時間

 Complete requests: 1000   //完成的請求數

 Failed requests: 0  //失敗的請求數

 Total transferred: 13701482 bytes  //整個場景中的網絡傳輸量

 HTML transferred: 13197000 bytes  //整個場景中的HTML內容傳輸量
  Requests per second: 19.66 [#/sec] (mean) //吞吐率,大家最關心的指標之一,相當於 LR 中的每秒事務數,後面括號中的 mean 表示這是一個平均值

  Time per request: 5087.180 [ms] (mean) //用戶平均請求等待時間,大家最關心的指標之二,相當於 LR 中的平均事務響應時間,後面括號中的 mean 表示這是一個平均值

  Time per request: 50.872 [ms] (mean, across all concurrent requests) //服務器平均請求處理時間,大家最關心的指標之三

  Transfer rate: 263.02 [Kbytes/sec] received    //平均每秒網絡上的流量,可以幫助排除是否存在網絡流量過大導致響應時間延長的問題
CentOS壓力測試 ab 命令安裝與使用