
(轉)Arcgis for Js之Graphiclayer擴展詳解
http://blog.csdn.net/gisshixisheng/article/details/41208185
在前兩節,講到了兩種不同方式的聚類,一種是基於距離的,一種是基於區域範圍的,兩種不同的聚類都是通過擴展esri/layers/GraphicsLayer方法來實現的。在本節,就詳細的講講esri/layers/GraphicsLayer方法的擴展。
首先,在講解擴展之前,先看看API中esri/layers/GraphicsLayer的一些參數和方法等。
1、創建一個GraphicLayer
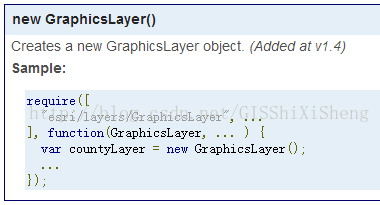
在ESRI官方的API中,創建GraphicLayer有兩種方式:
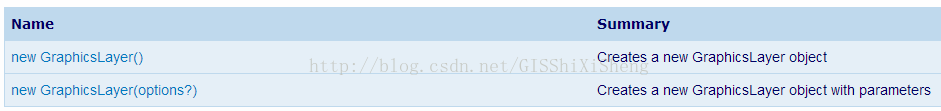
例如:
或者:
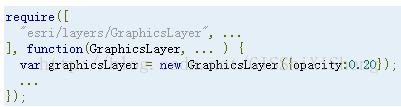
在第二種方式的options的參數包括:

2、GraphicLayer的屬性
GraphicLayer的屬性包括:

其中,有幾個比較常見和重要的屬性為:
a、graphics:數組,返回的參數是一個數組,為GraphicLayer中包含的Graphic對象。
b、visiable:布爾型,Graphiclayer是否可見。
c、visiableAtMapScale:布爾型,在特定比例尺下的可見性。
3、Graphiclayer的方法
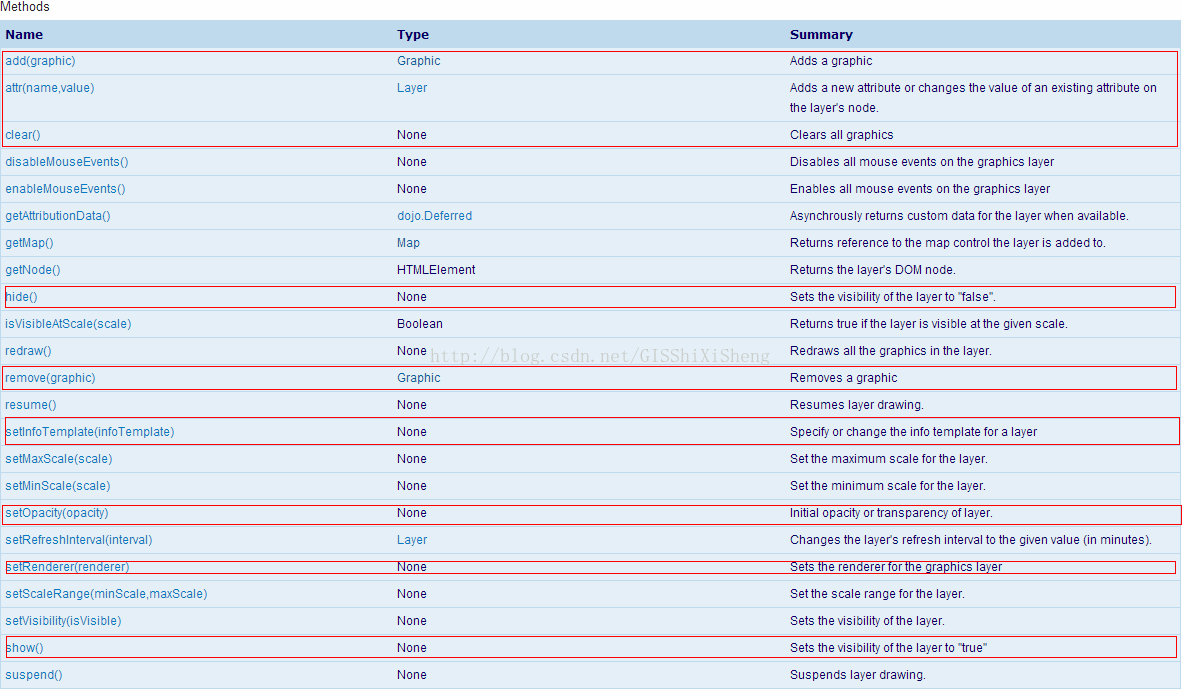
圖中,紅框標出的是Graphiclayer最常用的方法,詳細的介紹很清楚,在此不再做贅述了。
接下來,擴展Graphiclayer。
GraphicLayer藏得很深,位於library\3.9\3.9\js\esri\layers\GraphicsLayer.js,雖然對參數變量代碼做了混淆,但是有些東西還是沒做變化。在做GraphicLayer擴展時,有幾個是比較常用的:
a、_setMap
[javascript] view plain copy print?
- // 重構esri/layers/GraphicsLayer方法
- _setMap: function(map, surface) {
- // GraphicsLayer will add its own listener here
- var div = this.inherited(arguments);
- return div;
- }
b、_unsetMap
[html] view plain copy print?
- _unsetMap: function() {
- this.inherited(arguments);
- }
c、_draw
[javascript] view plain copy print?
- _draw:function(graphic, redrawFlag, zoomFlag){
- if (!this._map) {
- return;
- }
- }
此外,還有一些地圖控制的,如:_onPanStartHandler,_onZoomStartHandler,_onExtentChangeHandler等。擴展GraphicLayer的大概框架代碼如下:
[javascript] view plain copy print?
- define([
- "dojo/_base/declare",
- "esri/layers/GraphicsLayer"
- ], function (
- declare,
- GraphicsLayer
- ) {
- return declare([GraphicsLayer], {
- constructor: function(options) {
- //參數設置
- this._id = options.id || "";
- this._divId = options.chartDiv || "chart";
- },
- // 重構esri/layers/GraphicsLayer方法
- _setMap: function(map, surface) {
- // GraphicsLayer will add its own listener here
- var div = this.inherited(arguments);
- return div;
- },
- _unsetMap: function() {
- this.inherited(arguments);
- },
- //拖拽
- _onPanStartHandler: function() {
- //
- },
- //縮放
- _onZoomStartHandler:function(){
- //
- },
- _onExtentChangeHandler: function(delta, extent, levelChange, lod) {
- //
- },
- _draw:function(graphic){
- if (!this._map) {
- return;
- }
- //
- }
- });
- });
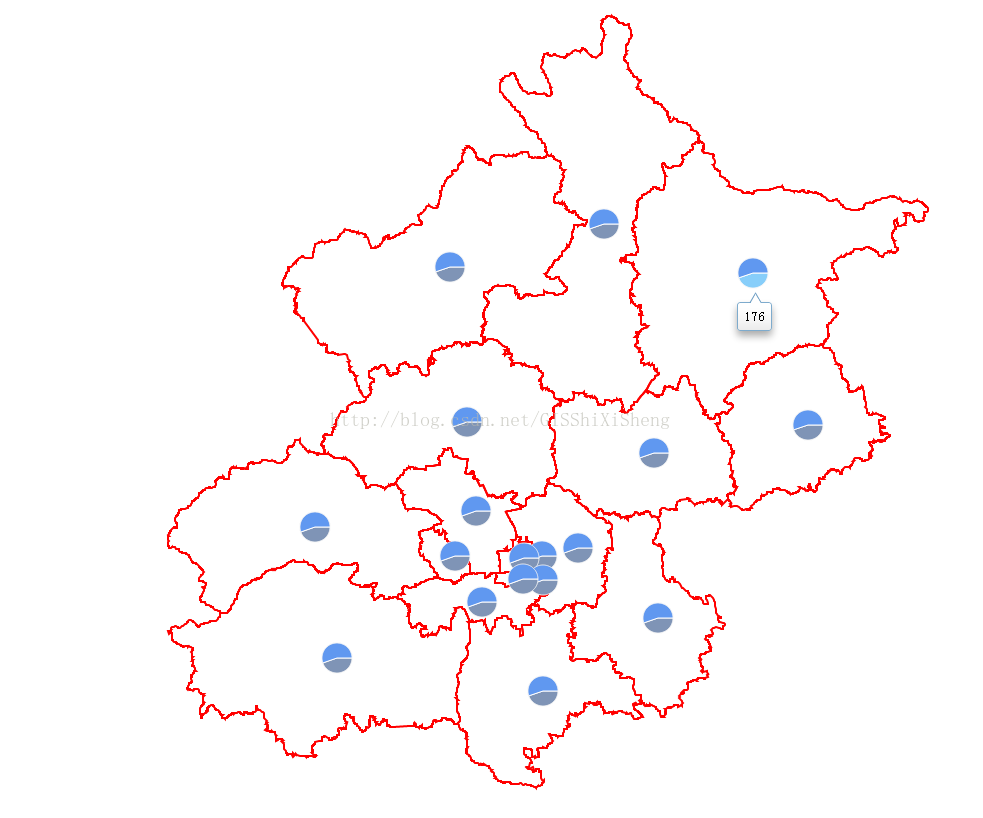
例子:添加統計圖
統計圖通過dojo chart實現,代碼如下:
[javascript] view plain copy print?
- define([
- "dojo/_base/declare",
- "esri/layers/GraphicsLayer",
- "esri/geometry/Point",
- "esri/graphic",
- "dojox/charting/Chart2D",
- "dojox/charting/themes/PlotKit/blue",
- "dojox/charting/action2d/Highlight",
- "dojox/charting/action2d/Tooltip"
- ], function (
- declare,
- GraphicsLayer,
- Point,
- Graphic,
- Chart2D,
- theme,
- Highlight,
- Tooltip
- ) {
- return declare([GraphicsLayer], {
- constructor: function(options) {
- this._id = options.id || "";
- this._divId = options.chartDiv || "chart";
- this._charttype = options.chartType || "Pie";
- this._chartSize = options.size || 50;
- },
- // 重構esri/layers/GraphicsLayer方法
- _setMap: function(map, surface) {
- // GraphicsLayer will add its own listener here
- var div = this.inherited(arguments);
- return div;
- },
- _unsetMap: function() {
- this.inherited(arguments);
- },
- hide: function() {
- dojo.style(dojo.byId(this._divId),{
- "display": "none"
- });
- },
- show: function() {
- dojo.style(dojo.byId(this._divId),{
- "display": ""
- });
- },
- //拖拽
- _onPanStartHandler: function() {
- this.hide();
- },
- //縮放
- _onZoomStartHandler:function(){
- this.hide();
- },
- _onExtentChangeHandler: function() {
- this._refresh(true);
- },
- _refresh: function(redraw) {
- var that=this;
- var gs = this.graphics,
- _draw = this._draw;
- for (i = 0; i < gs.length; i++) {
- _draw(gs[i], redraw);
- }
- this.show();
- },
- _draw:function(graphic, redraw){
- if (!this._map) {
- return;
- }
- if(graphic instanceof Graphic)//判斷graphic是否為MapChartGraphic類型
- {
- this._drawChart(graphic,redraw);
- }
- },
- _drawChart:function(graphic,redraw){
- var showMapPt = graphic.geometry,
- attribute = graphic.attributes;
- var showPt = map.toScreen(showMapPt);
- var id=attribute.code,
- series = [attribute.male, attribute.female];
- if(redraw){
- dojo.byId(this._divId).removeChild(dojo.byId("div"+id));
- }
- if(attribute){
- var _chartDiv = dojo.doc.createElement("div");
- _chartDiv.id ="div"+id;
- dojo.style(_chartDiv, {
- "left": (showPt.x-this._chartSize/4) + "px",
- "top": (showPt.y-this._chartSize/2) + "px",
- "position": "absolute",
- "width": this._chartSize + "px",
- "height": this._chartSize + "px"
- });
- dojo.byId(this._divId).appendChild(_chartDiv);
- var _chart = new Chart2D(_chartDiv);
- var _themes = dojox.charting.themes.PlotKit.blue;
- _themes.chart.fill = "transparent";
- _themes.chart.stroke = "transparent";
- _themes.plotarea.fill = "transparent";
- _chart.setTheme(_themes);
- switch(this._charttype){
- case "Pie":{//餅狀圖
- _chart.addPlot("default", {
- type: this._charttype,
- labels:false
- });
- break;
- }
- case "StackedColumns":{//柱狀堆積圖
- _chart.addPlot("default", {
- type: this._charttype,
- labels:false,
- markers: true,
- gap: 2
- });
- break;
- }
- case "Lines":{//柱狀堆積圖
- _chart.addPlot("default", {
- type: this._charttype,
- labels:false,
- markers: true,
- radius: 1,
- tension:"X"
- });
- break;
- }
- default:{//柱狀圖
- _chart.addPlot("default", {
- type: this._charttype,
- labels:false,
- gap: 3
- });
- chart.addAxis("y", { vertical:true, fixLower: "major", fixUpper: "major" });
- break;
- }
- }
- _chart.addSeries(id, series,{stroke: {width:1}});
- //效果
- new Highlight(_chart, "default", {highlight: "lightskyblue"});
- new Tooltip(_chart, "default");
- _chart.render();
- }
- }
- });
- });
實現後的效果如下:
源碼下載地址:
鏈接:http://pan.baidu.com/s/1i3EbnF3 密碼:cvbf
(轉)Arcgis for Js之Graphiclayer擴展詳解