
Python學習筆記(4)——Matplotlib中的annotate(註解)的用法
阿新 • • 發佈:2018-12-12
在上一篇博文ID3決策樹演算法中,繪製決策樹時,使用了Matplotlib的註解工具annotate,藉此機會系統學習一下annotate的用法。
annotate用於在圖形上給資料新增文字註解,而且支援帶箭頭的劃線工具,方便我們在合適的位置新增描述資訊。
引數說明:
Axes.annotate(s, xy, *args, **kwargs)
- s:註釋文字的內容
- xy:被註釋的座標點,二維元組形如(x,y)
- xytext:註釋文字的座標點,也是二維元組,預設與xy相同
- xycoords:被註釋點的座標系屬性,允許輸入的值如下
| 屬性值 | 含義 |
|---|---|
| 'figure points' | 以繪圖區左下角為參考,單位是點數 |
| 'figure pixels' | 以繪圖區左下角為參考,單位是畫素數 |
| 'figure fraction' | 以繪圖區左下角為參考,單位是百分比 |
| 'axes points' | 以子繪圖區左下角為參考,單位是點數(一個figure可以有多個axex,預設為1個) |
| 'axes pixels' | 以子繪圖區左下角為參考,單位是畫素數 |
| 'axes fraction' | 以子繪圖區左下角為參考,單位是百分比 |
| 'data' | 以被註釋的座標點xy為參考 (預設值) |
| 'polar' | 不使用本地資料座標系,使用極座標系 |
- textcoords :註釋文字的座標系屬性,預設與xycoords屬性值相同,也可設為不同的值。除了允許輸入xycoords的屬性值,還允許輸入以下兩種:
| 屬性值 | 含義 |
|---|---|
| 'offset points' | 相對於被註釋點xy的偏移量(單位是點) |
| 'offset pixels' | 相對於被註釋點xy的偏移量(單位是畫素) |
arrowprops:箭頭的樣式,dict(字典)型資料,如果該屬性非空,則會在註釋文字和被註釋點之間畫一個箭頭。如果不設定'arrowstyle' 關鍵字,則允許包含以下關鍵字:
| 關鍵字 | 說明 |
|---|---|
| width | 箭頭的寬度(單位是點) |
| headwidth | 箭頭頭部的寬度(點) |
| headlength | 箭頭頭部的長度(點) |
| shrink | 箭頭兩端收縮的百分比(佔總長) |
如果設定了‘arrowstyle’關鍵字,以上關鍵字就不能使用。允許的值有:
| 箭頭的樣式 | 屬性 |
|---|---|
'-' |
None |
'->' |
head_length=0.4,head_width=0.2 |
'-[' |
widthB=1.0,lengthB=0.2,angleB=None |
'|-|' |
widthA=1.0,widthB=1.0 |
'-|>' |
head_length=0.4,head_width=0.2 |
'<-' |
head_length=0.4,head_width=0.2 |
'<->' |
head_length=0.4,head_width=0.2 |
'<|-' |
head_length=0.4,head_width=0.2 |
'<|-|>' |
head_length=0.4,head_width=0.2 |
'fancy' |
head_length=0.4,head_width=0.4,tail_width=0.4 |
'simple' |
head_length=0.5,head_width=0.5,tail_width=0.2 |
'wedge' |
tail_width=0.3,shrink_factor=0.5 |
| Key | Description |
|---|---|
| arrowstyle | 箭頭的樣式 |
| connectionstyle | 連線線的樣式 |
| relpos |
箭頭起始點相對註釋文字的位置,預設為 (0.5, 0.5),即文字的中心, (0,0)表示左下角,(1,1)表示右上角 |
| patchA | 箭頭起點處的圖形(matplotlib.patches物件),預設是註釋文字框 |
| patchB | 箭頭終點處的圖形(matplotlib.patches物件),預設為空 |
| shrinkA | 箭頭起點的縮排點數,預設為2 |
| shrinkB | 箭頭終點的縮排點數,預設為2 |
| mutation_scale | default is text size (in points) |
| mutation_aspect | default is 1. |
- annotation_clip : 布林值,可選引數,預設為空。設為True時,只有被註釋點在子圖區內時才繪製註釋;設為False時,無論被註釋點在哪裡都繪製註釋。僅當xycoords為‘data’時,預設值空相當於True。
返回值:
Annotation物件
示例:
- 一個基本的註釋示例,設定了箭頭的顏色和縮排,感興趣的話可以以此為基礎嘗試更多的屬性和樣式。
import numpy as np
import matplotlib.pyplot as plt

fig, ax = plt.subplots()

# 繪製一個餘弦曲線
t = np.arange(0.0, 5.0, 0.01)
s = np.cos(2*np.pi*t)
line, = ax.plot(t, s, lw=2)

# 繪製一個黑色,兩端縮排的箭頭
ax.annotate('local max', xy=(2, 1), xytext=(3, 1.5),
            xycoords='data',
            arrowprops=dict(facecolor='black', shrink=0.05)
            )
ax.set_ylim(-2, 2)
plt.show()
- 座標轉換示例——在本例中,我們學習用不同的座標體系繪製註釋。
import numpy as np
import matplotlib.pyplot as plt

# 以步長0.005繪製一個曲線
x = np.arange(0, 10, 0.005)
y = np.exp(-x/2.) * np.sin(2*np.pi*x)

fig, ax = plt.subplots()
ax.plot(x, y)
ax.set_xlim(0, 10)
ax.set_ylim(-1, 1)

# 被註釋點的資料軸座標和所在的畫素
xdata, ydata = 5, 0
xdisplay, ydisplay = ax.transData.transform_point((xdata, ydata))

# 設定註釋文字的樣式和箭頭的樣式
bbox = dict(boxstyle="round", fc="0.8")
arrowprops = dict(
    arrowstyle = "->",
    connectionstyle = "angle,angleA=0,angleB=90,rad=10")

# 設定偏移量
offset = 72
# xycoords預設為'data'資料軸座標,對座標點(5,0)添加註釋
# 註釋文字參考被註釋點設定偏移量,向左2*72points,向上72points
ax.annotate('data = (%.1f, %.1f)'%(xdata, ydata),
            (xdata, ydata), xytext=(-2*offset, offset), textcoords='offset points',
            bbox=bbox, arrowprops=arrowprops)

# xycoords以繪圖區左下角為參考,單位為畫素
# 註釋文字參考被註釋點設定偏移量,向右0.5*72points,向下72points
disp = ax.annotate('display = (%.1f, %.1f)'%(xdisplay, ydisplay),
            (xdisplay, ydisplay), xytext=(0.5*offset, -offset),
            xycoords='figure pixels',
            textcoords='offset points',
            bbox=bbox, arrowprops=arrowprops)


plt.show()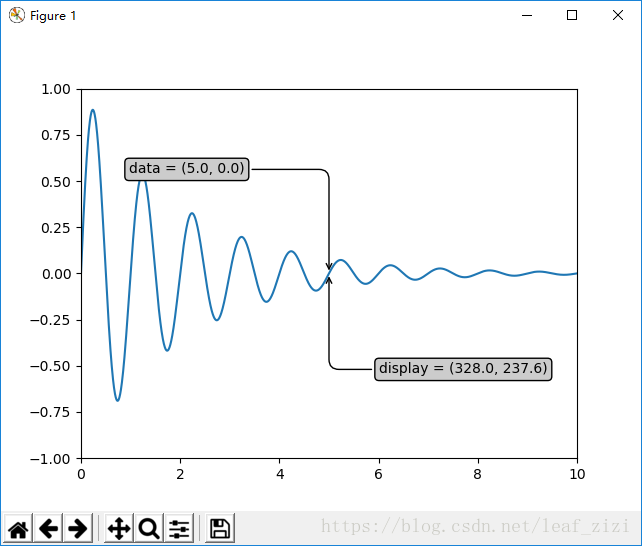
- 極座標上的註釋——在此例中,我們會在極座標系繪圖,並在極座標系設定被註釋點,以繪圖區的百分比為引數放置註釋文字。
import numpy as np
import matplotlib.pyplot as plt

# 繪製一個極地座標,再以0.001為步長,畫一條螺旋曲線
fig = plt.figure()
ax = fig.add_subplot(111, polar=True)
r = np.arange(0,1,0.001)
theta = 2 * 2*np.pi * r
line, = ax.plot(theta, r, color='#ee8d18', lw=3)

# 對索引為800處畫一個圓點,並做註釋
ind = 800
thisr, thistheta = r[ind], theta[ind]
ax.plot([thistheta], [thisr], 'o')
ax.annotate('a polar annotation',
            xy=(thistheta, thisr),  # 被註釋點遵循極座標系,座標為角度和半徑
            xytext=(0.05, 0.05),    # 註釋文字放在繪圖區的0.05百分比處
            textcoords='figure fraction',
            arrowprops=dict(facecolor='black', shrink=0.05),# 箭頭線為黑色,兩端縮排5%
            horizontalalignment='left',# 註釋文字的左端和低端對齊到指定位置
            verticalalignment='bottom',
            )
plt.show()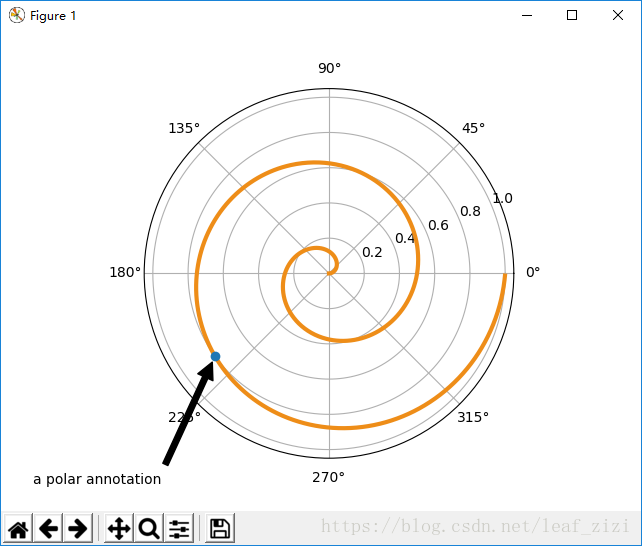
- 不同樣式的註釋文字示例
import matplotlib.pyplot as plt

# 設定繪圖區標題
fig = plt.figure()
fig.suptitle('bold figure suptitle', fontsize=14, fontweight='bold')

# 設定子繪圖區標題
ax = fig.add_subplot(111)
fig.subplots_adjust(top=0.85)
ax.set_title('axes title')

# 設定x y座標軸的標識
ax.set_xlabel('xlabel')
ax.set_ylabel('ylabel')

# 紅色、透明度0.5、邊框留白10
ax.text(3, 8, 'boxed italics text in data coords', style='italic',
        bbox={'facecolor':'red', 'alpha':0.5, 'pad':10})

# 文字中有數學公式
ax.text(2, 6, r'an equation: $E=mc^2$', fontsize=15)

# 文字中有ASCII碼
ax.text(3, 2, 'unicode: Institut f\374r Festk\366rperphysik')

# 轉換座標系
ax.text(0.95, 0.01, 'colored text in axes coords',
        verticalalignment='bottom', horizontalalignment='right',
        transform=ax.transAxes,
        color='green', fontsize=15)

# 在2,1處畫個圓點,添加註釋
ax.plot([2], [1], 'o')
ax.annotate('annotate', xy=(2, 1), xytext=(3, 4),
            arrowprops=dict(facecolor='black', shrink=0.05))

ax.axis([0, 10, 0, 10])

plt.show()
參考: